

Graphab 2.0 software (Foltête et al. 2012b) was used to construct landscape
graphs and perform all analysis (Software available at http://thema.univ-fcomte.fr/
productions/graphab/en-home.html).
Results
The graph modeling the ecological network of the tree frog contains 1464 nodes
ranging in size from 0.01 to 86 ha (mean 0.6 ha) and 2624 links (Fig. 13.1). The
network is highly fragmented with 264 components, i.e. the subparts of the graph
within which the species may move from one patch to another at the dispersal scale.
The largest components are located in the Ognon valley, where landscape is
dominated by wetlands and grasslands. This area has the largest number of sites of
this species in the region.
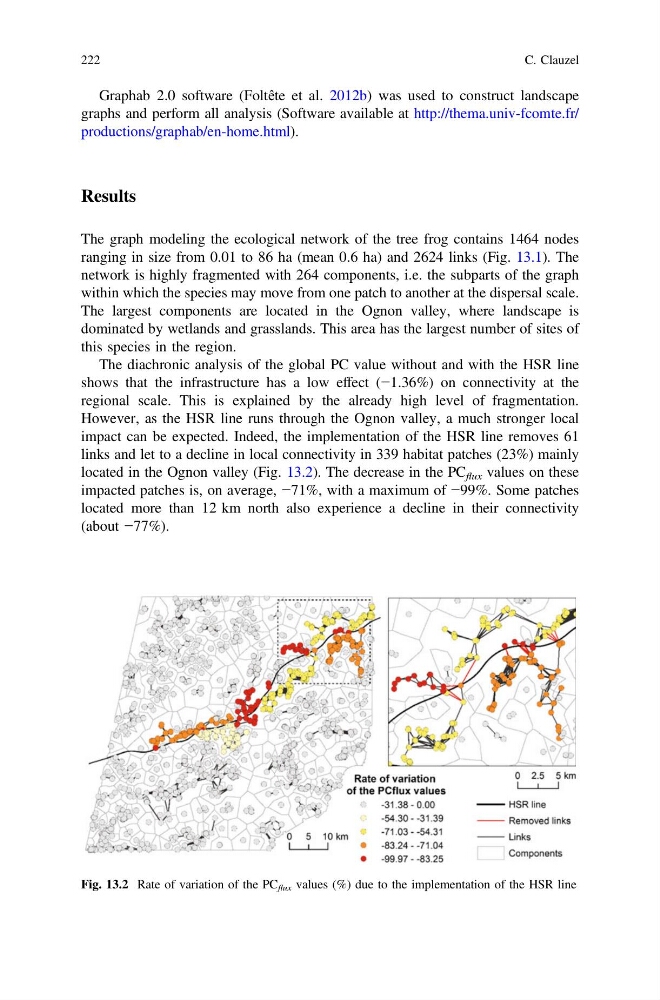
The diachronic analysis of the global PC value without and with the HSR line
shows that the infrastructure has a low effect (−1.36%) on connectivity at the
regional scale. This is explained by the already high level of fragmentation.
However, as the HSR line runs through the Ognon valley, a much stronger local
impact can be expected. Indeed, the implementation of the HSR line removes 61
links and let to a decline in local connectivity in 339 habitat patches (23%) mainly
located in the Ognon valley (Fig. 13.2). The decrease in the PC flux values on these
impacted patches is, on average, −71%, with a maximum of −99%. Some patches
located more than 12 km north also experience a decline in their connectivity
(about −77%).
Fig. 13.2 Rate of variation of the PC flux values (%) due to the implementation of the HSR line
222
C. Clauzel
graphs and perform all analysis (Software available at http://thema.univ-fcomte.fr/
productions/graphab/en-home.html).
Results
The graph modeling the ecological network of the tree frog contains 1464 nodes
ranging in size from 0.01 to 86 ha (mean 0.6 ha) and 2624 links (Fig. 13.1). The
network is highly fragmented with 264 components, i.e. the subparts of the graph
within which the species may move from one patch to another at the dispersal scale.
The largest components are located in the Ognon valley, where landscape is
dominated by wetlands and grasslands. This area has the largest number of sites of
this species in the region.
The diachronic analysis of the global PC value without and with the HSR line
shows that the infrastructure has a low effect (−1.36%) on connectivity at the
regional scale. This is explained by the already high level of fragmentation.
However, as the HSR line runs through the Ognon valley, a much stronger local
impact can be expected. Indeed, the implementation of the HSR line removes 61
links and let to a decline in local connectivity in 339 habitat patches (23%) mainly
located in the Ognon valley (Fig. 13.2). The decrease in the PC flux values on these
impacted patches is, on average, −71%, with a maximum of −99%. Some patches
located more than 12 km north also experience a decline in their connectivity
(about −77%).
Fig. 13.2 Rate of variation of the PC flux values (%) due to the implementation of the HSR line
222
C. Clauzel