

thus minimizing double counts (Bibby et al. 2005). We did not carry out counts on
days with adverse weather conditions, such as heavy rain and strong winds.
We used Generalized Linear Mixed Models (GLMM; Zuur et al. 2009) to
evaluate how species richness and wetland bird densities varied in relation to the
railway line. In order to model species’ richness, we used Poisson errors and a log
link, while the modelling of bird densities was done on log-transformed data using
Gaussian errors and the identity link (Zuur et al. 2009). As fixed effects, we used
dichotomous variables coding the distance to the railway line (<500 vs. >500 m)
and the stage of the tidal cycle (low vs. high tide), and the interaction between them.
We considered random effects on the intercept, including as factors the sector, the
sampling month, and the sampling year. Models were fit using the package lmer
(Bates et al. 2015) for the R software 3.2.2 (R Core Team 2015).
Results
Wetland Bird Assemblages
Overall, we counted 32,647 individuals of 46 wetland bird species during the
surveys (“Annex”). The most abundant species accounted for 71% of the birds
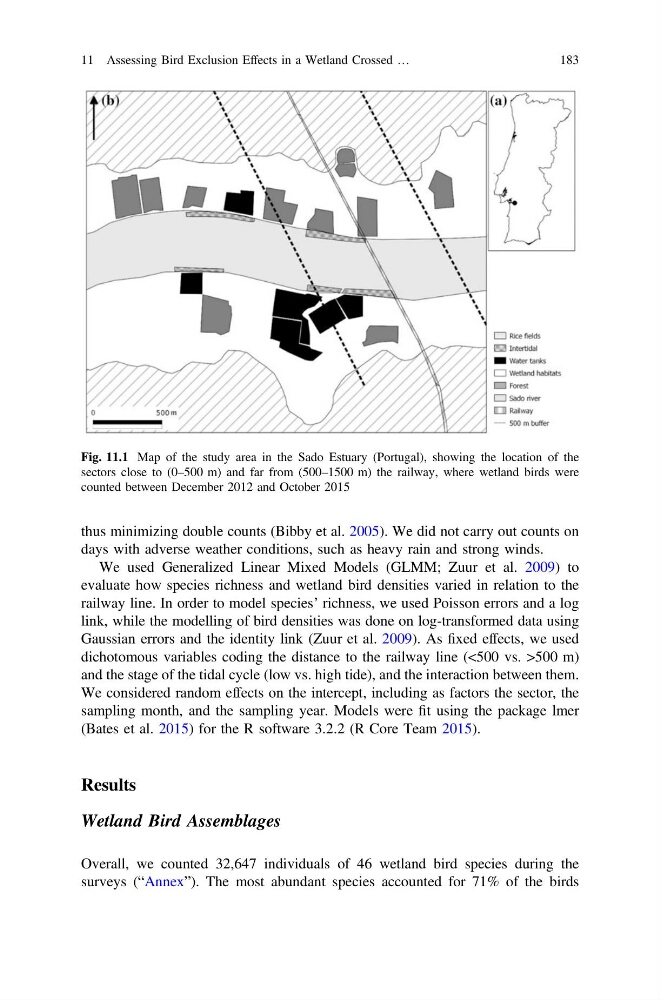
Fig. 11.1 Map of the study area in the Sado Estuary (Portugal), showing the location of the
sectors close to (0–500 m) and far from (500–1500 m) the railway, where wetland birds were
counted between December 2012 and October 2015
11 Assessing Bird Exclusion Effects in a Wetland Crossed …
183
days with adverse weather conditions, such as heavy rain and strong winds.
We used Generalized Linear Mixed Models (GLMM; Zuur et al. 2009) to
evaluate how species richness and wetland bird densities varied in relation to the
railway line. In order to model species’ richness, we used Poisson errors and a log
link, while the modelling of bird densities was done on log-transformed data using
Gaussian errors and the identity link (Zuur et al. 2009). As fixed effects, we used
dichotomous variables coding the distance to the railway line (<500 vs. >500 m)
and the stage of the tidal cycle (low vs. high tide), and the interaction between them.
We considered random effects on the intercept, including as factors the sector, the
sampling month, and the sampling year. Models were fit using the package lmer
(Bates et al. 2015) for the R software 3.2.2 (R Core Team 2015).
Results
Wetland Bird Assemblages
Overall, we counted 32,647 individuals of 46 wetland bird species during the
surveys (“Annex”). The most abundant species accounted for 71% of the birds
Fig. 11.1 Map of the study area in the Sado Estuary (Portugal), showing the location of the
sectors close to (0–500 m) and far from (500–1500 m) the railway, where wetland birds were
counted between December 2012 and October 2015
11 Assessing Bird Exclusion Effects in a Wetland Crossed …
183