

one with a higher correlation to the response remained in the analysis (Guisan and
Zimmermann 2000). Based on this cut-off, track grade was significantly correlated
with train speed and was removed from the analysis.
Results
Strike Rates
Over the 21-year period (1989–2009), 862 strikes were recorded along 134 km of
the CPR, consisting of 579 elk, 185 deer, 69 black bears, 9 grizzly bears, and 1
unidentified bear species. The bear data were combined into one class for further
analysis. The spatial distribution of strikes per rail segment were non-uniform for
elk v
2 (1, 27) = 834.4, p < 0.001, deer v
2 (1, 27) = 252.5, p < 0.001, and bears
v
2 (1, 27) = 37.1, p = 0.03 (Fig. 9.3).
The strike rates also varied temporally for elk, deer, and bears (Fig. 9.4).
A decreasing trend was detected for elk strikes [b elk = −1.04, t(19) = −2.29,
p = 0.03], and conversely an increasing trend for deer [b deer = 1.13, t(19) = 8.18,
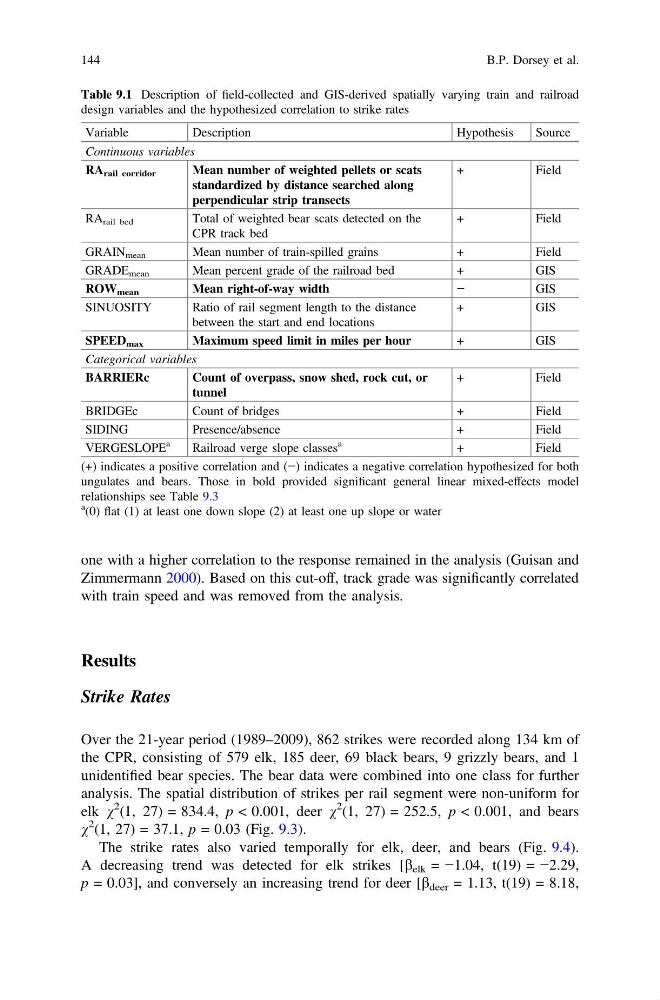
Table 9.1 Description of field-collected and GIS-derived spatially varying train and railroad
design variables and the hypothesized correlation to strike rates
Variable
Description
Hypothesis
Source
Continuous variables
RA rail corridor
Mean number of weighted pellets or scats
standardized by distance searched along
perpendicular strip transects
+
Field
RA rail bed
Total of weighted bear scats detected on the
CPR track bed
+
Field
GRAIN mean
Mean number of train-spilled grains
+
Field
GRADE mean
Mean percent grade of the railroad bed
+
GIS
ROW mean
Mean right-of-way width
−
GIS
SINUOSITY
Ratio of rail segment length to the distance
between the start and end locations
+
GIS
SPEED max
Maximum speed limit in miles per hour
+
GIS
Categorical variables
BARRIERc
Count of overpass, snow shed, rock cut, or
tunnel
+
Field
BRIDGEc
Count of bridges
+
Field
SIDING
Presence/absence
+
Field
VERGESLOPE
a
Railroad verge slope classes
a
+
Field
(+) indicates a positive correlation and (−) indicates a negative correlation hypothesized for both
ungulates and bears. Those in bold provided significant general linear mixed-effects model
relationships see Table 9.3
a (0) flat (1) at least one down slope (2) at least one up slope or water
144
B.P. Dorsey et al.
Zimmermann 2000). Based on this cut-off, track grade was significantly correlated
with train speed and was removed from the analysis.
Results
Strike Rates
Over the 21-year period (1989–2009), 862 strikes were recorded along 134 km of
the CPR, consisting of 579 elk, 185 deer, 69 black bears, 9 grizzly bears, and 1
unidentified bear species. The bear data were combined into one class for further
analysis. The spatial distribution of strikes per rail segment were non-uniform for
elk v
2 (1, 27) = 834.4, p < 0.001, deer v
2 (1, 27) = 252.5, p < 0.001, and bears
v
2 (1, 27) = 37.1, p = 0.03 (Fig. 9.3).
The strike rates also varied temporally for elk, deer, and bears (Fig. 9.4).
A decreasing trend was detected for elk strikes [b elk = −1.04, t(19) = −2.29,
p = 0.03], and conversely an increasing trend for deer [b deer = 1.13, t(19) = 8.18,
Table 9.1 Description of field-collected and GIS-derived spatially varying train and railroad
design variables and the hypothesized correlation to strike rates
Variable
Description
Hypothesis
Source
Continuous variables
RA rail corridor
Mean number of weighted pellets or scats
standardized by distance searched along
perpendicular strip transects
+
Field
RA rail bed
Total of weighted bear scats detected on the
CPR track bed
+
Field
GRAIN mean
Mean number of train-spilled grains
+
Field
GRADE mean
Mean percent grade of the railroad bed
+
GIS
ROW mean
Mean right-of-way width
−
GIS
SINUOSITY
Ratio of rail segment length to the distance
between the start and end locations
+
GIS
SPEED max
Maximum speed limit in miles per hour
+
GIS
Categorical variables
BARRIERc
Count of overpass, snow shed, rock cut, or
tunnel
+
Field
BRIDGEc
Count of bridges
+
Field
SIDING
Presence/absence
+
Field
VERGESLOPE
a
Railroad verge slope classes
a
+
Field
(+) indicates a positive correlation and (−) indicates a negative correlation hypothesized for both
ungulates and bears. Those in bold provided significant general linear mixed-effects model
relationships see Table 9.3
a (0) flat (1) at least one down slope (2) at least one up slope or water
144
B.P. Dorsey et al.