

7.4.3 Development of Solar Physics
In the 1980s and 1990s, solar observations have been greatly advanced through the
construction of the (DST) (1979), the Nobeyama Heliogragh (1992), and the
launching of the Yohkoh Solar Satellite (1991–2003).The role of Yohkoh was
particularly notable.
Observations of soft-X ray images of Yohkoh and radio images at 17 GHz
obtained with the Nobeyama Heliograph for impulsive radio flares that occurred
on August 12, 1992, were made simultaneously by Takano Toshiaki, Enome Shinzo,
and their group, as shown in Fig. 7.17 (Takano, Enome et al. 1994). The Yohkoh
images are shown in (a) through (h) in color in the order of observed time. In images
(a) and (g), X-ray images are superimposed by three coronal loops (SXT L À 1,
L À 2, and L À 3). The radio flares are illustrated as contours in images (b), (d), and
(h), corresponding to the phases of preflare, impulsive flare, and decaying flare,
respectively. Image (i) indicates an illustration of the proposed connectivity of the
magnetic loops. The radio spectra of flares showed a peak at about 6 GHz with
nonthermal feature. Takano’s group suggested that the radio emissions in the
impulsive phase were of the gyrosynchrotron type emitted from high-energy electrons accelerated in the flare.
Collaborative observations by Yohkoh and DST were carried out in the early
1990s, and a close relationship between X-ray loops and Hα flare kernels was found
in some active flares (Kurokawa et al. 1992).
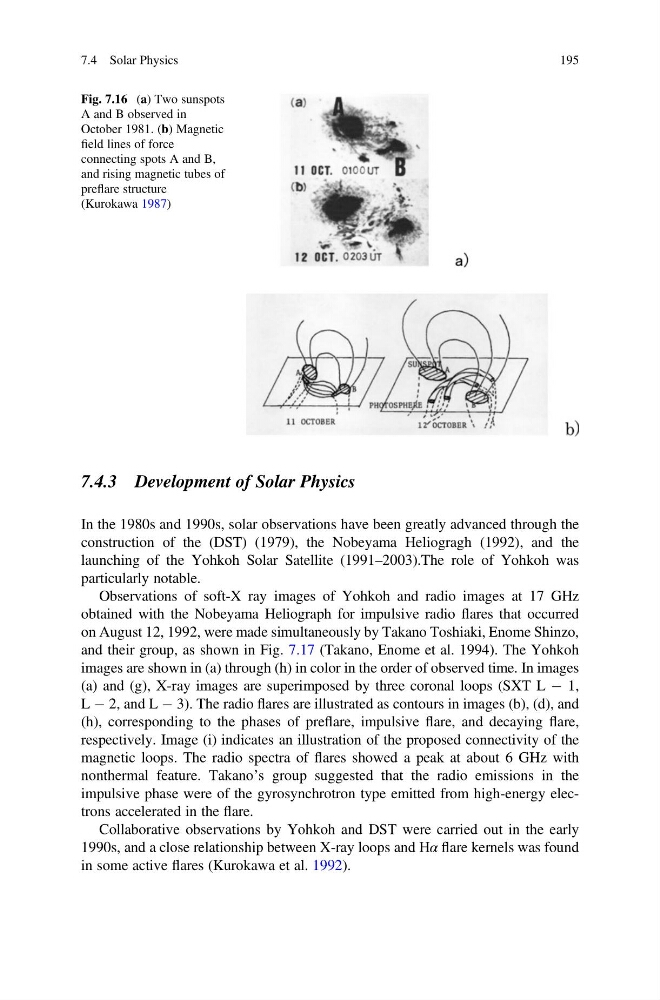
Fig. 7.16 (a) Two sunspots
A and B observed in
October 1981. (b) Magnetic
field lines of force
connecting spots A and B,
and rising magnetic tubes of
preflare structure
(Kurokawa 1987)
7.4 Solar Physics
195
In the 1980s and 1990s, solar observations have been greatly advanced through the
construction of the (DST) (1979), the Nobeyama Heliogragh (1992), and the
launching of the Yohkoh Solar Satellite (1991–2003).The role of Yohkoh was
particularly notable.
Observations of soft-X ray images of Yohkoh and radio images at 17 GHz
obtained with the Nobeyama Heliograph for impulsive radio flares that occurred
on August 12, 1992, were made simultaneously by Takano Toshiaki, Enome Shinzo,
and their group, as shown in Fig. 7.17 (Takano, Enome et al. 1994). The Yohkoh
images are shown in (a) through (h) in color in the order of observed time. In images
(a) and (g), X-ray images are superimposed by three coronal loops (SXT L À 1,
L À 2, and L À 3). The radio flares are illustrated as contours in images (b), (d), and
(h), corresponding to the phases of preflare, impulsive flare, and decaying flare,
respectively. Image (i) indicates an illustration of the proposed connectivity of the
magnetic loops. The radio spectra of flares showed a peak at about 6 GHz with
nonthermal feature. Takano’s group suggested that the radio emissions in the
impulsive phase were of the gyrosynchrotron type emitted from high-energy electrons accelerated in the flare.
Collaborative observations by Yohkoh and DST were carried out in the early
1990s, and a close relationship between X-ray loops and Hα flare kernels was found
in some active flares (Kurokawa et al. 1992).
Fig. 7.16 (a) Two sunspots
A and B observed in
October 1981. (b) Magnetic
field lines of force
connecting spots A and B,
and rising magnetic tubes of
preflare structure
(Kurokawa 1987)
7.4 Solar Physics
195