

38
3 Computational Analysis of Flow and Mixing in Micromixers
Mixing Length (mm)
Mixing Index
0
2
4
6
8
1 0
1 2
1 4
1 6
0
0.1
0.2
0.3
0.4
0.5
0.6
0.7
0.8
0.9
1
Tafti et al.
Present study
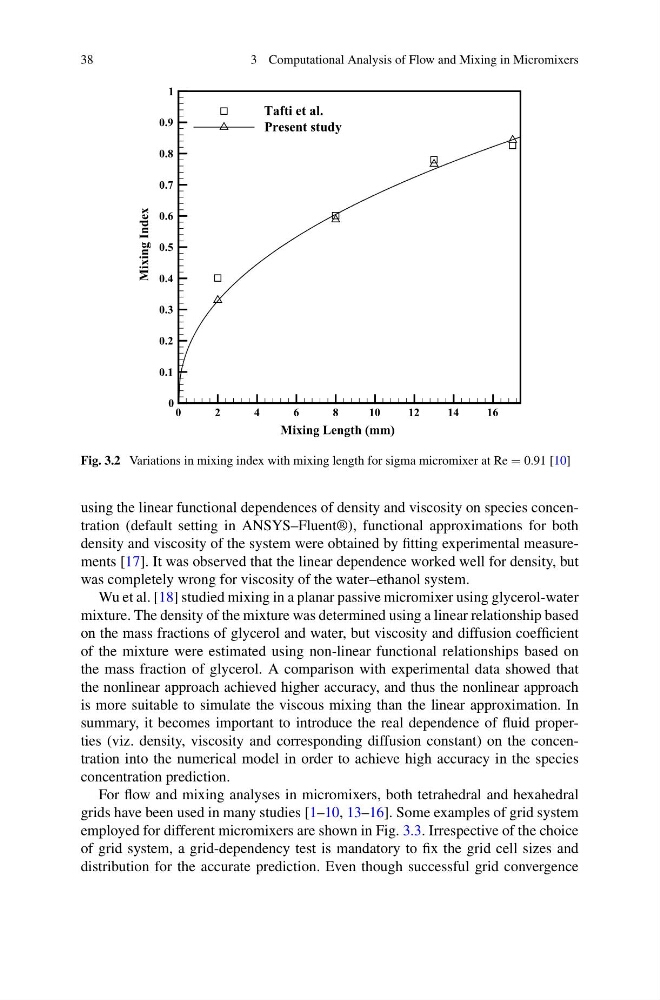
Fig. 3.2 Variations in mixing index with mixing length for sigma micromixer at Re = 0.91 [10]
using the linear functional dependences of density and viscosity on species concentration (default setting in ANSYS–Fluent®), functional approximations for both
density and viscosity of the system were obtained by fitting experimental measurements [17]. It was observed that the linear dependence worked well for density, but
was completely wrong for viscosity of the water–ethanol system.
Wu et al. [18] studied mixing in a planar passive micromixer using glycerol-water
mixture. The density of the mixture was determined using a linear relationship based
on the mass fractions of glycerol and water, but viscosity and diffusion coefficient
of the mixture were estimated using non-linear functional relationships based on
the mass fraction of glycerol. A comparison with experimental data showed that
the nonlinear approach achieved higher accuracy, and thus the nonlinear approach
is more suitable to simulate the viscous mixing than the linear approximation. In
summary, it becomes important to introduce the real dependence of fluid properties (viz. density, viscosity and corresponding diffusion constant) on the concentration into the numerical model in order to achieve high accuracy in the species
concentration prediction.
For flow and mixing analyses in micromixers, both tetrahedral and hexahedral
grids have been used in many studies [1–10, 13–16]. Some examples of grid system
employed for different micromixers are shown in Fig. 3.3. Irrespective of the choice
of grid system, a grid-dependency test is mandatory to fix the grid cell sizes and
distribution for the accurate prediction. Even though successful grid convergence
3 Computational Analysis of Flow and Mixing in Micromixers
Mixing Length (mm)
Mixing Index
0
2
4
6
8
1 0
1 2
1 4
1 6
0
0.1
0.2
0.3
0.4
0.5
0.6
0.7
0.8
0.9
1
Tafti et al.
Present study
Fig. 3.2 Variations in mixing index with mixing length for sigma micromixer at Re = 0.91 [10]
using the linear functional dependences of density and viscosity on species concentration (default setting in ANSYS–Fluent®), functional approximations for both
density and viscosity of the system were obtained by fitting experimental measurements [17]. It was observed that the linear dependence worked well for density, but
was completely wrong for viscosity of the water–ethanol system.
Wu et al. [18] studied mixing in a planar passive micromixer using glycerol-water
mixture. The density of the mixture was determined using a linear relationship based
on the mass fractions of glycerol and water, but viscosity and diffusion coefficient
of the mixture were estimated using non-linear functional relationships based on
the mass fraction of glycerol. A comparison with experimental data showed that
the nonlinear approach achieved higher accuracy, and thus the nonlinear approach
is more suitable to simulate the viscous mixing than the linear approximation. In
summary, it becomes important to introduce the real dependence of fluid properties (viz. density, viscosity and corresponding diffusion constant) on the concentration into the numerical model in order to achieve high accuracy in the species
concentration prediction.
For flow and mixing analyses in micromixers, both tetrahedral and hexahedral
grids have been used in many studies [1–10, 13–16]. Some examples of grid system
employed for different micromixers are shown in Fig. 3.3. Irrespective of the choice
of grid system, a grid-dependency test is mandatory to fix the grid cell sizes and
distribution for the accurate prediction. Even though successful grid convergence