

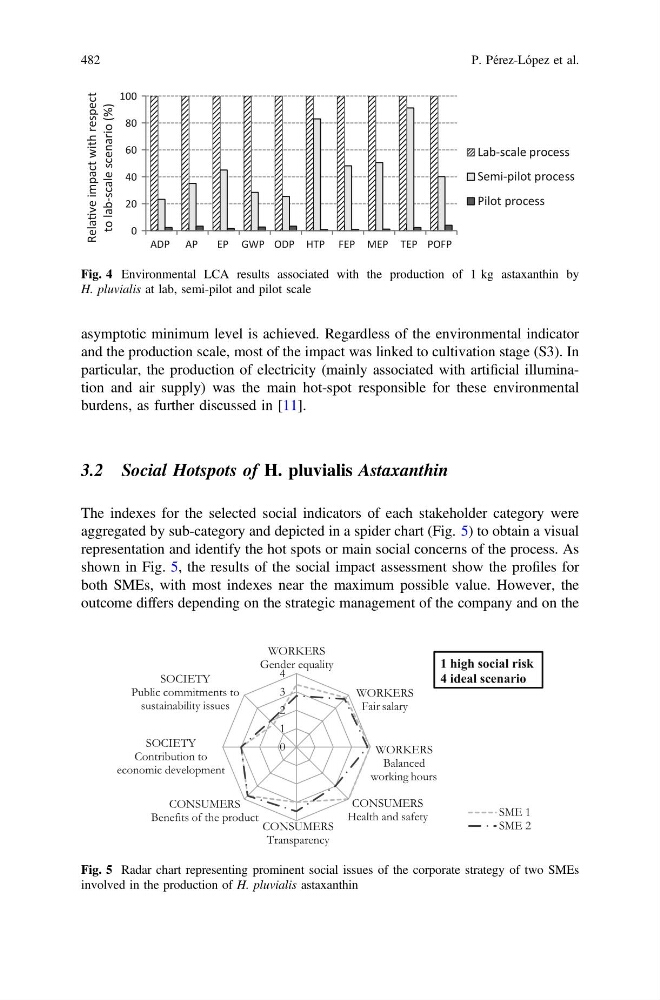
asymptotic minimum level is achieved. Regardless of the environmental indicator
and the production scale, most of the impact was linked to cultivation stage (S3). In
particular, the production of electricity (mainly associated with artificial illumination and air supply) was the main hot-spot responsible for these environmental
burdens, as further discussed in [11].
3.2 Social Hotspots of H. pluvialis Astaxanthin
The indexes for the selected social indicators of each stakeholder category were
aggregated by sub-category and depicted in a spider chart (Fig. 5) to obtain a visual
representation and identify the hot spots or main social concerns of the process. As
shown in Fig. 5, the results of the social impact assessment show the profiles for
both SMEs, with most indexes near the maximum possible value. However, the
outcome differs depending on the strategic management of the company and on the
0
20
40
60
80
100
ADP AP
EP GWP ODP HTP FEP MEP TEP POFP
RelaƟve impact with respect
to lab-scale scenario (%)
Lab-scale process
Semi-pilot process
Pilot process
Fig. 4 Environmental LCA results associated with the production of 1 kg astaxanthin by
H. pluvialis at lab, semi-pilot and pilot scale
0
1
2
3
4
SME 1
SME 2
WORKERS
Gender equality
WORKERS
Fair salary
WORKERS
Balanced
working hours
CONSUMERS
Health and safety
CONSUMERS
Transparency
CONSUMERS
Benefits of the product
SOCIETY
Contribution to
economic development
SOCIETY
Public commitments to
sustainability issues
1 high social risk
4 ideal scenario
Fig. 5 Radar chart representing prominent social issues of the corporate strategy of two SMEs
involved in the production of H. pluvialis astaxanthin
482
P. Pérez-López et al.
and the production scale, most of the impact was linked to cultivation stage (S3). In
particular, the production of electricity (mainly associated with artificial illumination and air supply) was the main hot-spot responsible for these environmental
burdens, as further discussed in [11].
3.2 Social Hotspots of H. pluvialis Astaxanthin
The indexes for the selected social indicators of each stakeholder category were
aggregated by sub-category and depicted in a spider chart (Fig. 5) to obtain a visual
representation and identify the hot spots or main social concerns of the process. As
shown in Fig. 5, the results of the social impact assessment show the profiles for
both SMEs, with most indexes near the maximum possible value. However, the
outcome differs depending on the strategic management of the company and on the
0
20
40
60
80
100
ADP AP
EP GWP ODP HTP FEP MEP TEP POFP
RelaƟve impact with respect
to lab-scale scenario (%)
Lab-scale process
Semi-pilot process
Pilot process
Fig. 4 Environmental LCA results associated with the production of 1 kg astaxanthin by
H. pluvialis at lab, semi-pilot and pilot scale
0
1
2
3
4
SME 1
SME 2
WORKERS
Gender equality
WORKERS
Fair salary
WORKERS
Balanced
working hours
CONSUMERS
Health and safety
CONSUMERS
Transparency
CONSUMERS
Benefits of the product
SOCIETY
Contribution to
economic development
SOCIETY
Public commitments to
sustainability issues
1 high social risk
4 ideal scenario
Fig. 5 Radar chart representing prominent social issues of the corporate strategy of two SMEs
involved in the production of H. pluvialis astaxanthin
482
P. Pérez-López et al.