

Copenhagen has been and continues to lead cities on climate policy globally. It
ranked top of Siemens’ European Green City Index in 2009 [11], and it is making
great strides meeting its 2025 target for carbon neutrality. Siemens has used the
CyPT and found that the City of Copenhagen is reducing emissions from nearly all
of the sources where it has significant control in energy and transport.
Copenhagen is decoupling its CO 2 eq. emissions so that despite a growing
population and increasing building floor-space, carbon emissions are expected to
decrease over the next 10 years. This is predominantly derived from greener
national electricity and local heating mixes. Using our accounting standard that
captures direct and indirect emissions, our model quantifies these savings as high as
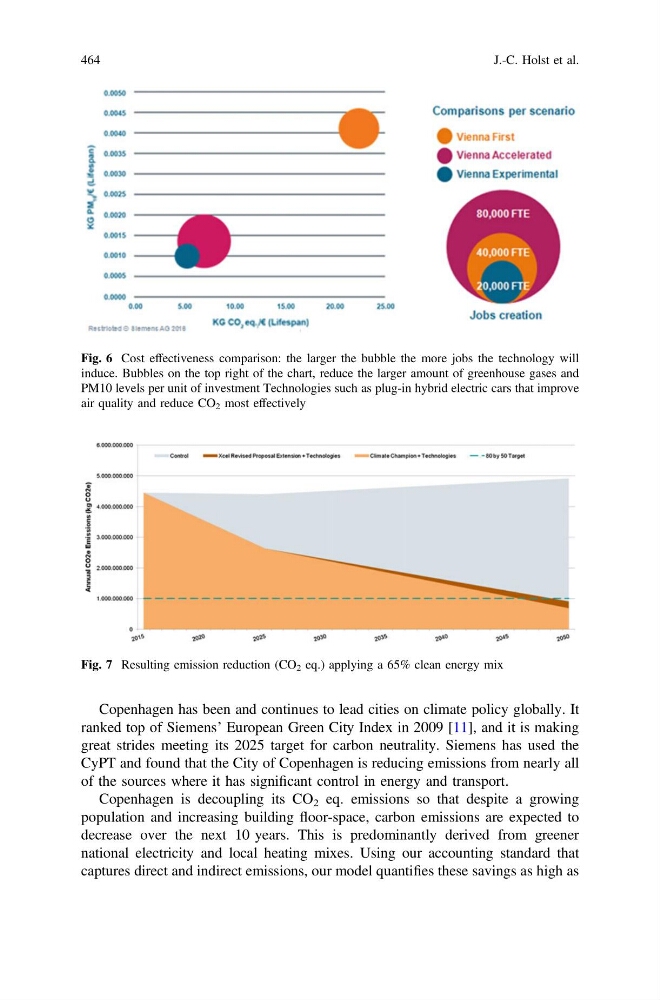
Fig. 6 Cost effectiveness comparison: the larger the bubble the more jobs the technology will
induce. Bubbles on the top right of the chart, reduce the larger amount of greenhouse gases and
PM10 levels per unit of investment Technologies such as plug-in hybrid electric cars that improve
air quality and reduce CO 2 most effectively
Fig. 7 Resulting emission reduction (CO 2 eq.) applying a 65% clean energy mix
464
J.-C. Holst et al.
ranked top of Siemens’ European Green City Index in 2009 [11], and it is making
great strides meeting its 2025 target for carbon neutrality. Siemens has used the
CyPT and found that the City of Copenhagen is reducing emissions from nearly all
of the sources where it has significant control in energy and transport.
Copenhagen is decoupling its CO 2 eq. emissions so that despite a growing
population and increasing building floor-space, carbon emissions are expected to
decrease over the next 10 years. This is predominantly derived from greener
national electricity and local heating mixes. Using our accounting standard that
captures direct and indirect emissions, our model quantifies these savings as high as
Fig. 6 Cost effectiveness comparison: the larger the bubble the more jobs the technology will
induce. Bubbles on the top right of the chart, reduce the larger amount of greenhouse gases and
PM10 levels per unit of investment Technologies such as plug-in hybrid electric cars that improve
air quality and reduce CO 2 most effectively
Fig. 7 Resulting emission reduction (CO 2 eq.) applying a 65% clean energy mix
464
J.-C. Holst et al.