

urban development. In times of constrained budgets city leaders carefully need to
identify their infrastructure investments ensuring that their investments address their
environmental and economic priorities. Technologies need to be adapted to serve
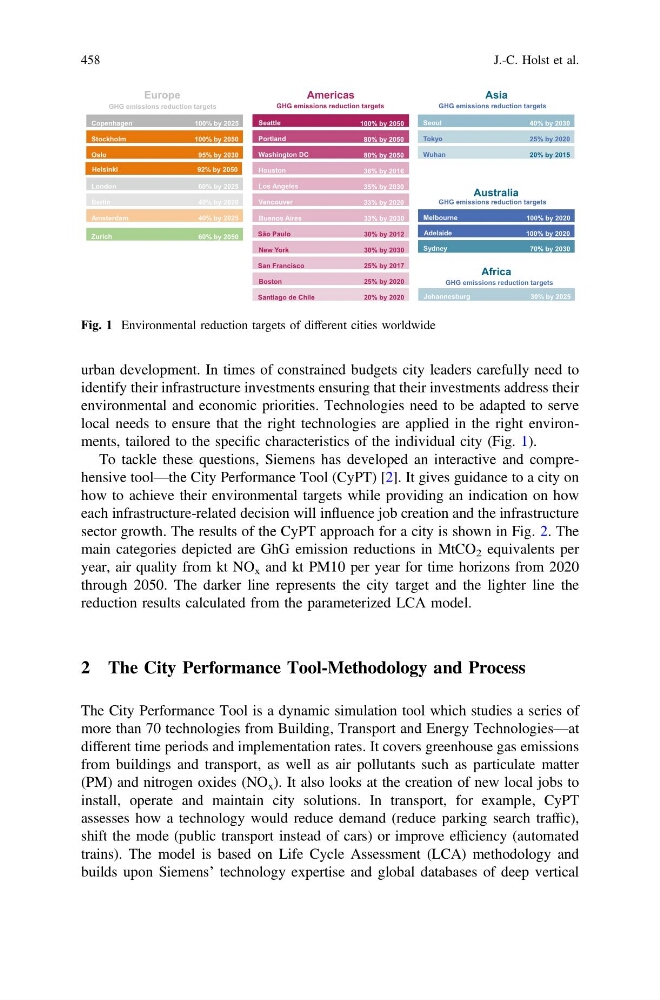
local needs to ensure that the right technologies are applied in the right environments, tailored to the specific characteristics of the individual city (Fig. 1).
To tackle these questions, Siemens has developed an interactive and comprehensive tool—the City Performance Tool (CyPT) [2]. It gives guidance to a city on
how to achieve their environmental targets while providing an indication on how
each infrastructure-related decision will influence job creation and the infrastructure
sector growth. The results of the CyPT approach for a city is shown in Fig. 2. The
main categories depicted are GhG emission reductions in MtCO 2 equivalents per
year, air quality from kt NO x and kt PM10 per year for time horizons from 2020
through 2050. The darker line represents the city target and the lighter line the
reduction results calculated from the parameterized LCA model.
2 The City Performance Tool-Methodology and Process
The City Performance Tool is a dynamic simulation tool which studies a series of
more than 70 technologies from Building, Transport and Energy Technologies—at
different time periods and implementation rates. It covers greenhouse gas emissions
from buildings and transport, as well as air pollutants such as particulate matter
(PM) and nitrogen oxides (NO x ). It also looks at the creation of new local jobs to
install, operate and maintain city solutions. In transport, for example, CyPT
assesses how a technology would reduce demand (reduce parking search traffic),
shift the mode (public transport instead of cars) or improve efficiency (automated
trains). The model is based on Life Cycle Assessment (LCA) methodology and
builds upon Siemens’ technology expertise and global databases of deep vertical
Copenhagen
Stockholm
Amsterdam
Oslo
Berlin
London
Seattle
Portland
Vancouver
Washington DC
Los Angeles
Houston
Buenos Aires
São Paulo
Santiago de Chile
New York
Boston
San Francisco
Seoul
Tokyo
Wuhan
Melbourne
Sydney
Johannesburg
100% by 2025
40% by 2025
100% by 2050
40% by 2020
60% by 2025
95% by 2030
100% by 2050
33% by 2020
80% by 2050
35% by 2030
36% by 2016
80% by 2050
33% by 2030
20% by 2020
30% by 2012
25% by 2020
25% by 2017
30% by 2030
40% by 2030
25% by 2020
20% by 2015
100% by 2020
70% by 2030
30% by 2025
Europe
Americas
Asia
Australia
Africa
GHG emissions reduction targets
GHG emissions reduction targets
GHG emissions reduction targets
GHG emissions reduction targets
GHG emissions reduction targets
Adelaide
100% by 2020
Helsinki
92% by 2050
Zurich
60% by 2050
Fig. 1 Environmental reduction targets of different cities worldwide
458
J.-C. Holst et al.
identify their infrastructure investments ensuring that their investments address their
environmental and economic priorities. Technologies need to be adapted to serve
local needs to ensure that the right technologies are applied in the right environments, tailored to the specific characteristics of the individual city (Fig. 1).
To tackle these questions, Siemens has developed an interactive and comprehensive tool—the City Performance Tool (CyPT) [2]. It gives guidance to a city on
how to achieve their environmental targets while providing an indication on how
each infrastructure-related decision will influence job creation and the infrastructure
sector growth. The results of the CyPT approach for a city is shown in Fig. 2. The
main categories depicted are GhG emission reductions in MtCO 2 equivalents per
year, air quality from kt NO x and kt PM10 per year for time horizons from 2020
through 2050. The darker line represents the city target and the lighter line the
reduction results calculated from the parameterized LCA model.
2 The City Performance Tool-Methodology and Process
The City Performance Tool is a dynamic simulation tool which studies a series of
more than 70 technologies from Building, Transport and Energy Technologies—at
different time periods and implementation rates. It covers greenhouse gas emissions
from buildings and transport, as well as air pollutants such as particulate matter
(PM) and nitrogen oxides (NO x ). It also looks at the creation of new local jobs to
install, operate and maintain city solutions. In transport, for example, CyPT
assesses how a technology would reduce demand (reduce parking search traffic),
shift the mode (public transport instead of cars) or improve efficiency (automated
trains). The model is based on Life Cycle Assessment (LCA) methodology and
builds upon Siemens’ technology expertise and global databases of deep vertical
Copenhagen
Stockholm
Amsterdam
Oslo
Berlin
London
Seattle
Portland
Vancouver
Washington DC
Los Angeles
Houston
Buenos Aires
São Paulo
Santiago de Chile
New York
Boston
San Francisco
Seoul
Tokyo
Wuhan
Melbourne
Sydney
Johannesburg
100% by 2025
40% by 2025
100% by 2050
40% by 2020
60% by 2025
95% by 2030
100% by 2050
33% by 2020
80% by 2050
35% by 2030
36% by 2016
80% by 2050
33% by 2030
20% by 2020
30% by 2012
25% by 2020
25% by 2017
30% by 2030
40% by 2030
25% by 2020
20% by 2015
100% by 2020
70% by 2030
30% by 2025
Europe
Americas
Asia
Australia
Africa
GHG emissions reduction targets
GHG emissions reduction targets
GHG emissions reduction targets
GHG emissions reduction targets
GHG emissions reduction targets
Adelaide
100% by 2020
Helsinki
92% by 2050
Zurich
60% by 2050
Fig. 1 Environmental reduction targets of different cities worldwide
458
J.-C. Holst et al.