

169
Impact
Fraction of total global
impact embodied in trade
(absolute amount, year)
Largest exporter (i), largest
importer (ii), largest bilateral
trade fl ow (iii), gross fl ows, not
net fl ows
a
Method (name of database/model)
References
Ozone precursors
emissions
(NMVOC, CH
4 ,
CO, NO
x )
28 %
(109 Mt NMVOCe,
2008)
(i) China (17.4 Mt NMVOCe)
MRIO analysis (WIOD)
Arto et al. ( 2012 )
(ii) USA (18.6 Mt NMVOCe)
Acid emissions
(NH
3 , NO
x , SO
x )
26 %
(2.1 Mt H
+
e, 2008)
(i) China (0.65 Mt H
+
e)
MRIO analysis (WIOD)
Arto et al. ( 2012 )
(ii) USA (0.35 Mt H
+
e)
(a) Labour
(a) 18 %
(560 million
persons-year equivalents,
2007)
(a) (i) China (130 mpeq)
(a) MRIO analysis (EXIOBASE)
(a) Simas et al. ( 2015 )
(ii) USA (115 mpeq)
(iii) China to USA (27 mFTE,
2010, Alsamawi et al. ( 2014a ))
(b) ‘Bad’ labour
(b) 16 %
for total labour, 15
%
for low-skilled labour, 17
%
for forced labour, 18 %
for occupational health
damage, 19 %
for child
labour, 19 %
for vulnerable
employment, 20 %
for
hazardous child labour and
38 %
for labour by women
(all numbers for trade
between seven world regions)
(b) (i) The APAC region is the
largest exporter of all forms of
(bad) labour, except for child
labour and hazardous child
labour for which Africa is the
largest exporter
(b) MRIO analysis (EXIOBASE)
(b) Simas et al. ( 2014 )
(ii) n.p.
(iii) APAC to Europe for all forms
of (bad) labour, except for child
labour and hazardous child labour
for which Africa to Europe is the
largest fl ow
Wages
n.p.
(iii) USA to Japan (112 US$bn,
2010)
MRIO analysis (Eora)
Alsamawi et al. ( 2014a )
a
Same year as fraction unless otherwise stated
b
n.p.
not provided
c
EEBT
emissions embodied in bilateral trade
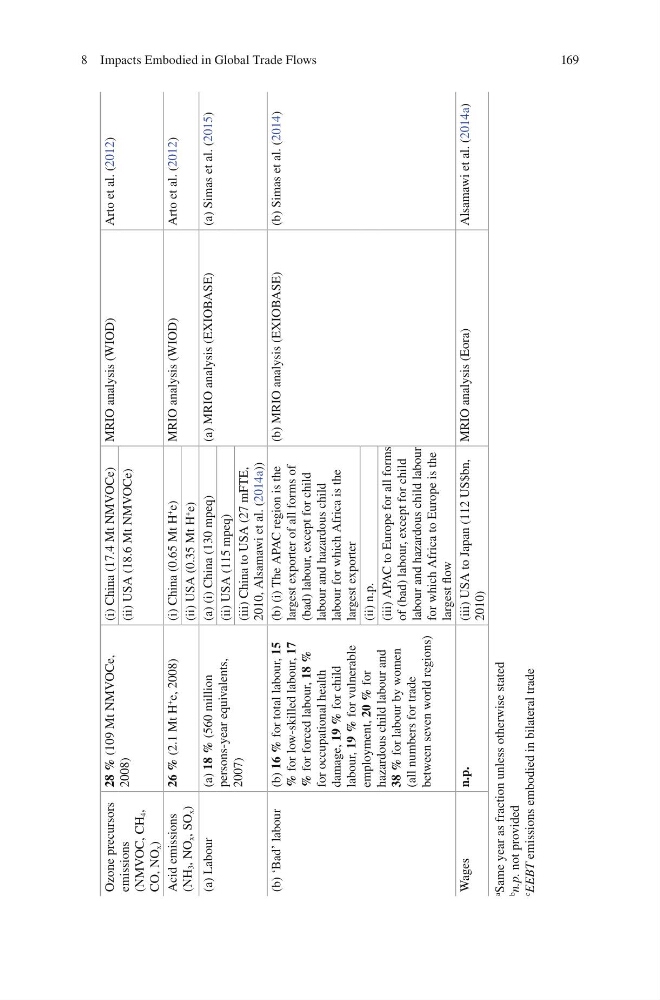
8 Impacts Embodied in Global Trade Flows
Impact
Fraction of total global
impact embodied in trade
(absolute amount, year)
Largest exporter (i), largest
importer (ii), largest bilateral
trade fl ow (iii), gross fl ows, not
net fl ows
a
Method (name of database/model)
References
Ozone precursors
emissions
(NMVOC, CH
4 ,
CO, NO
x )
28 %
(109 Mt NMVOCe,
2008)
(i) China (17.4 Mt NMVOCe)
MRIO analysis (WIOD)
Arto et al. ( 2012 )
(ii) USA (18.6 Mt NMVOCe)
Acid emissions
(NH
3 , NO
x , SO
x )
26 %
(2.1 Mt H
+
e, 2008)
(i) China (0.65 Mt H
+
e)
MRIO analysis (WIOD)
Arto et al. ( 2012 )
(ii) USA (0.35 Mt H
+
e)
(a) Labour
(a) 18 %
(560 million
persons-year equivalents,
2007)
(a) (i) China (130 mpeq)
(a) MRIO analysis (EXIOBASE)
(a) Simas et al. ( 2015 )
(ii) USA (115 mpeq)
(iii) China to USA (27 mFTE,
2010, Alsamawi et al. ( 2014a ))
(b) ‘Bad’ labour
(b) 16 %
for total labour, 15
%
for low-skilled labour, 17
%
for forced labour, 18 %
for occupational health
damage, 19 %
for child
labour, 19 %
for vulnerable
employment, 20 %
for
hazardous child labour and
38 %
for labour by women
(all numbers for trade
between seven world regions)
(b) (i) The APAC region is the
largest exporter of all forms of
(bad) labour, except for child
labour and hazardous child
labour for which Africa is the
largest exporter
(b) MRIO analysis (EXIOBASE)
(b) Simas et al. ( 2014 )
(ii) n.p.
(iii) APAC to Europe for all forms
of (bad) labour, except for child
labour and hazardous child labour
for which Africa to Europe is the
largest fl ow
Wages
n.p.
(iii) USA to Japan (112 US$bn,
2010)
MRIO analysis (Eora)
Alsamawi et al. ( 2014a )
a
Same year as fraction unless otherwise stated
b
n.p.
not provided
c
EEBT
emissions embodied in bilateral trade
8 Impacts Embodied in Global Trade Flows