

165
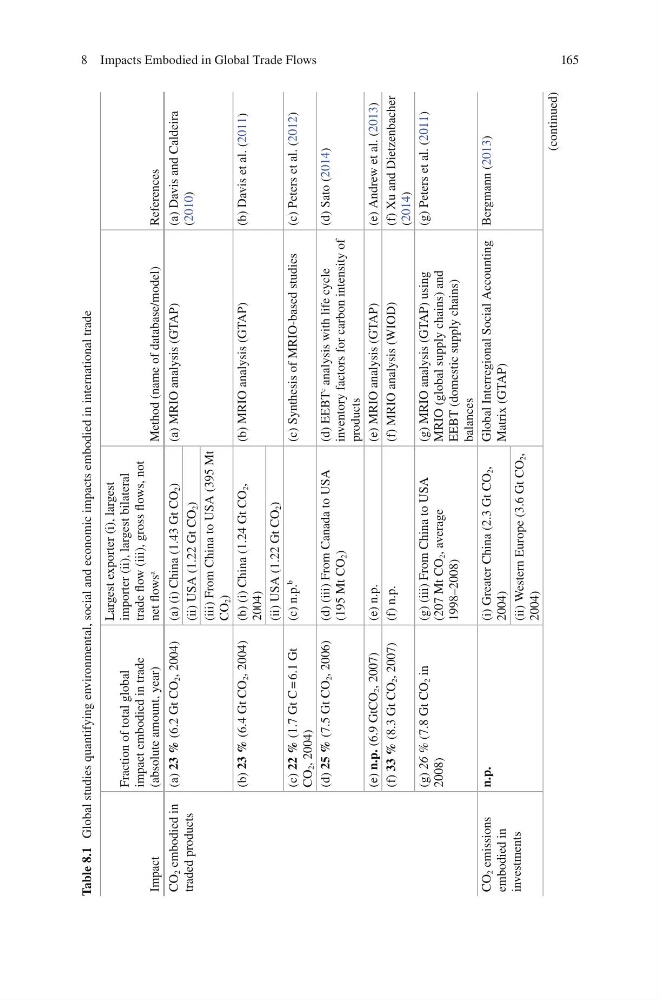
Table 8.1
Global studies quantifying environmental, social and economic impacts embodied in international trade
Impact
Fraction of total global
impact embodied in trade
(absolute amount, year)
Largest exporter (i), largest
importer (ii), largest bilateral
trade fl ow (iii), gross fl ows, not
net fl ows
a
Method (name of database/model)
References
CO
2 embodied in
traded products
(a) 23 %
(6.2 Gt CO
2 , 2004)
(a) (i) China (1.43 Gt CO
2 )
(a) MRIO analysis (GTAP)
(a) Davis and Caldeira
( 2010 )
(ii) USA (1.22 Gt CO
2 )
(iii) From China to USA (395 Mt
CO
2 )
(b) 23 %
(6.4 Gt CO
2 , 2004)
(b) (i) China (1.24 Gt CO
2 ,
2004)
(b) MRIO analysis (GTAP)
(b) Davis et al. ( 2011 )
(ii) USA (1.22 Gt CO
2 )
(c) 22 %
(1.7 Gt C = 6.1 Gt
CO
2 , 2004)
(c) n.p.
b
(c) Synthesis of MRIO-based studies
(c) Peters et al. ( 2012 )
(d) 25 %
(7.5 Gt CO
2 , 2006)
(d) (iii) From Canada to USA
(195 Mt CO
2 )
(d) EEBT
c
analysis with life cycle
inventory factors for carbon intensity of
products
(d) Sato ( 2014 )
(e) n.p.
(6.9 GtCO
2 , 2007)
(e) n.p.
(e) MRIO analysis (GTAP)
(e) Andrew et al. ( 2013 )
(f) 33 %
(8.3 Gt CO
2 , 2007)
(f) n.p.
(f) MRIO analysis (WIOD)
(f) Xu and Dietzenbacher
( 2014 )
(g) 26 %
(7.8 Gt CO
2 in
2008)
(g) (iii) From China to USA
(207 Mt CO
2 , average
1998–2008)
(g) MRIO analysis (GTAP) using
MRIO (global supply chains) and
EEBT (domestic supply chains)
balances
(g) Peters et al. ( 2011 )
CO
2 emissions
embodied in
investments
n.p.
(i) Greater China (2.3 Gt CO
2 ,
2004)
Global Interregional Social Accounting
Matrix (GTAP)
Bergmann ( 2013 )
(ii) Western Europe (3.6 Gt CO
2 ,
2004)
(continued)
8 Impacts Embodied in Global Trade Flows
Table 8.1
Global studies quantifying environmental, social and economic impacts embodied in international trade
Impact
Fraction of total global
impact embodied in trade
(absolute amount, year)
Largest exporter (i), largest
importer (ii), largest bilateral
trade fl ow (iii), gross fl ows, not
net fl ows
a
Method (name of database/model)
References
CO
2 embodied in
traded products
(a) 23 %
(6.2 Gt CO
2 , 2004)
(a) (i) China (1.43 Gt CO
2 )
(a) MRIO analysis (GTAP)
(a) Davis and Caldeira
( 2010 )
(ii) USA (1.22 Gt CO
2 )
(iii) From China to USA (395 Mt
CO
2 )
(b) 23 %
(6.4 Gt CO
2 , 2004)
(b) (i) China (1.24 Gt CO
2 ,
2004)
(b) MRIO analysis (GTAP)
(b) Davis et al. ( 2011 )
(ii) USA (1.22 Gt CO
2 )
(c) 22 %
(1.7 Gt C = 6.1 Gt
CO
2 , 2004)
(c) n.p.
b
(c) Synthesis of MRIO-based studies
(c) Peters et al. ( 2012 )
(d) 25 %
(7.5 Gt CO
2 , 2006)
(d) (iii) From Canada to USA
(195 Mt CO
2 )
(d) EEBT
c
analysis with life cycle
inventory factors for carbon intensity of
products
(d) Sato ( 2014 )
(e) n.p.
(6.9 GtCO
2 , 2007)
(e) n.p.
(e) MRIO analysis (GTAP)
(e) Andrew et al. ( 2013 )
(f) 33 %
(8.3 Gt CO
2 , 2007)
(f) n.p.
(f) MRIO analysis (WIOD)
(f) Xu and Dietzenbacher
( 2014 )
(g) 26 %
(7.8 Gt CO
2 in
2008)
(g) (iii) From China to USA
(207 Mt CO
2 , average
1998–2008)
(g) MRIO analysis (GTAP) using
MRIO (global supply chains) and
EEBT (domestic supply chains)
balances
(g) Peters et al. ( 2011 )
CO
2 emissions
embodied in
investments
n.p.
(i) Greater China (2.3 Gt CO
2 ,
2004)
Global Interregional Social Accounting
Matrix (GTAP)
Bergmann ( 2013 )
(ii) Western Europe (3.6 Gt CO
2 ,
2004)
(continued)
8 Impacts Embodied in Global Trade Flows