

6.2 Autocorrelation Function
55
0
0.005
0.01
0.015
t (sec)
10
-2
10
-1
10
0
C
B
z
(t)/C
B
z
(0)
experiment
DSIM
NNSI
free plasma
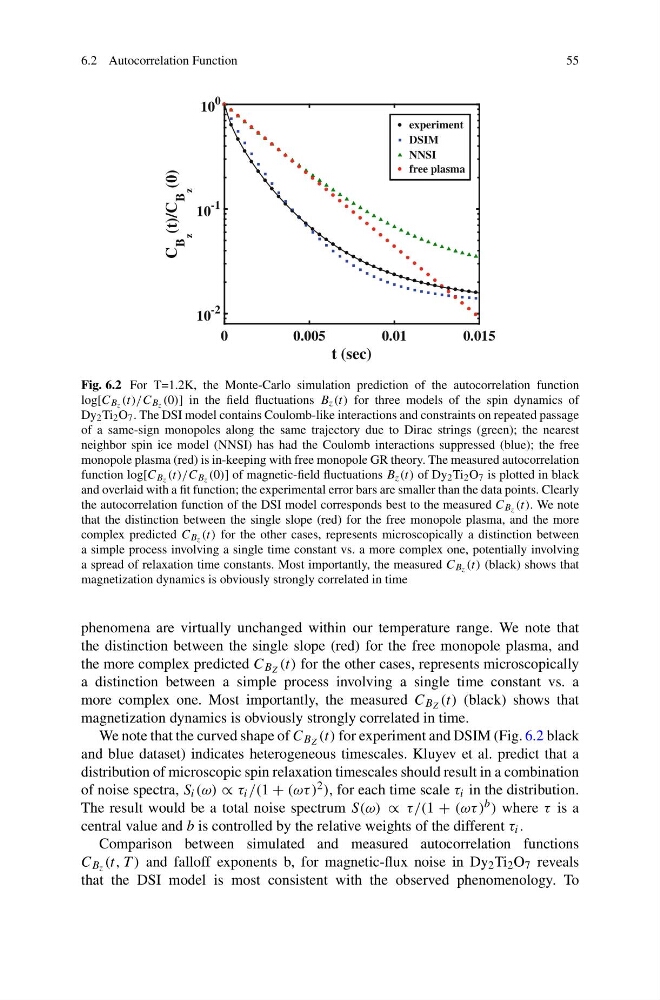
Fig. 6.2 For T=1.2K, the Monte-Carlo simulation prediction of the autocorrelation function
log[C Bz (t)/C Bz (0)] in the field fluctuations B z (t) for three models of the spin dynamics of
Dy 2 Ti 2 O 7 . The DSI model contains Coulomb-like interactions and constraints on repeated passage
of a same-sign monopoles along the same trajectory due to Dirac strings (green); the nearest
neighbor spin ice model (NNSI) has had the Coulomb interactions suppressed (blue); the free
monopole plasma (red) is in-keeping with free monopole GR theory. The measured autocorrelation
function log[C Bz (t)/C Bz (0)] of magnetic-field fluctuations B z (t) of Dy 2 Ti 2 O 7 is plotted in black
and overlaid with a fit function; the experimental error bars are smaller than the data points. Clearly
the autocorrelation function of the DSI model corresponds best to the measured C Bz (t). We note
that the distinction between the single slope (red) for the free monopole plasma, and the more
complex predicted C Bz (t) for the other cases, represents microscopically a distinction between
a simple process involving a single time constant vs. a more complex one, potentially involving
a spread of relaxation time constants. Most importantly, the measured C Bz (t) (black) shows that
magnetization dynamics is obviously strongly correlated in time
phenomena are virtually unchanged within our temperature range. We note that
the distinction between the single slope (red) for the free monopole plasma, and
the more complex predicted C B Z (t) for the other cases, represents microscopically
a distinction between a simple process involving a single time constant vs. a
more complex one. Most importantly, the measured C B Z (t) (black) shows that
magnetization dynamics is obviously strongly correlated in time.
We note that the curved shape of C B Z (t) for experiment and DSIM (Fig. 6.2 black
and blue dataset) indicates heterogeneous timescales. Kluyev et al. predict that a
distribution of microscopic spin relaxation timescales should result in a combination
of noise spectra, S i (ω) ∝ τ i /(1 + (ωτ ) 2 ), for each time scale τ i in the distribution.
The result would be a total noise spectrum S(ω) ∝ τ/(1 + (ωτ ) b ) where τ is a
central value and b is controlled by the relative weights of the different τ i .
Comparison between simulated and measured autocorrelation functions
C B z (t, T ) and falloff exponents b, for magnetic-flux noise in Dy 2 Ti 2 O 7 reveals
that the DSI model is most consistent with the observed phenomenology. To
55
0
0.005
0.01
0.015
t (sec)
10
-2
10
-1
10
0
C
B
z
(t)/C
B
z
(0)
experiment
DSIM
NNSI
free plasma
Fig. 6.2 For T=1.2K, the Monte-Carlo simulation prediction of the autocorrelation function
log[C Bz (t)/C Bz (0)] in the field fluctuations B z (t) for three models of the spin dynamics of
Dy 2 Ti 2 O 7 . The DSI model contains Coulomb-like interactions and constraints on repeated passage
of a same-sign monopoles along the same trajectory due to Dirac strings (green); the nearest
neighbor spin ice model (NNSI) has had the Coulomb interactions suppressed (blue); the free
monopole plasma (red) is in-keeping with free monopole GR theory. The measured autocorrelation
function log[C Bz (t)/C Bz (0)] of magnetic-field fluctuations B z (t) of Dy 2 Ti 2 O 7 is plotted in black
and overlaid with a fit function; the experimental error bars are smaller than the data points. Clearly
the autocorrelation function of the DSI model corresponds best to the measured C Bz (t). We note
that the distinction between the single slope (red) for the free monopole plasma, and the more
complex predicted C Bz (t) for the other cases, represents microscopically a distinction between
a simple process involving a single time constant vs. a more complex one, potentially involving
a spread of relaxation time constants. Most importantly, the measured C Bz (t) (black) shows that
magnetization dynamics is obviously strongly correlated in time
phenomena are virtually unchanged within our temperature range. We note that
the distinction between the single slope (red) for the free monopole plasma, and
the more complex predicted C B Z (t) for the other cases, represents microscopically
a distinction between a simple process involving a single time constant vs. a
more complex one. Most importantly, the measured C B Z (t) (black) shows that
magnetization dynamics is obviously strongly correlated in time.
We note that the curved shape of C B Z (t) for experiment and DSIM (Fig. 6.2 black
and blue dataset) indicates heterogeneous timescales. Kluyev et al. predict that a
distribution of microscopic spin relaxation timescales should result in a combination
of noise spectra, S i (ω) ∝ τ i /(1 + (ωτ ) 2 ), for each time scale τ i in the distribution.
The result would be a total noise spectrum S(ω) ∝ τ/(1 + (ωτ ) b ) where τ is a
central value and b is controlled by the relative weights of the different τ i .
Comparison between simulated and measured autocorrelation functions
C B z (t, T ) and falloff exponents b, for magnetic-flux noise in Dy 2 Ti 2 O 7 reveals
that the DSI model is most consistent with the observed phenomenology. To