

50
5 Analysis
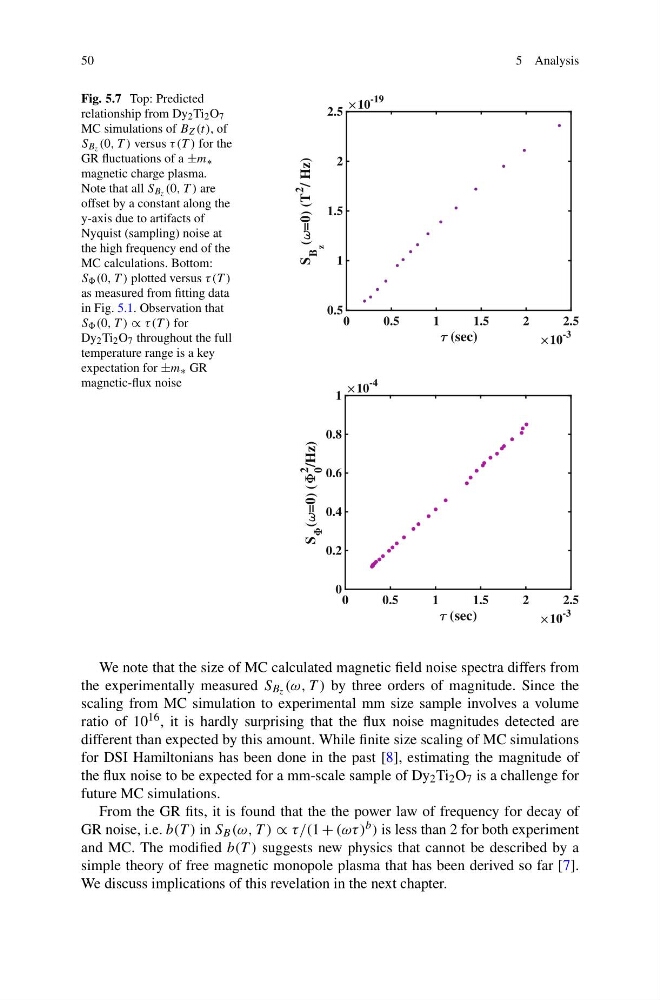
Fig. 5.7 Top: Predicted
relationship from Dy 2 Ti 2 O 7
MC simulations of B Z (t), of
S Bz (0, T ) versus τ (T ) for the
GR fluctuations of a ±m ∗
magnetic charge plasma.
Note that all S Bz (0, T ) are
offset by a constant along the
y-axis due to artifacts of
Nyquist (sampling) noise at
the high frequency end of the
MC calculations. Bottom:
S (0, T ) plotted versus τ (T )
as measured from fitting data
in Fig. 5.1. Observation that
S (0, T ) ∝ τ (T ) for
Dy 2 Ti 2 O 7 throughout the full
temperature range is a key
expectation for ±m ∗ GR
magnetic-flux noise
0
0.5
1
1.5
2
2.5
(sec)
10
-3
0
0.2
0.4
0.6
0.8
1
S ( =0) (
0
2
/Hz)
10
-4
0
0.5
1
1.5
2
2.5
(sec)
10
-3
0.5
1
1.5
2
2.5
S
B
z
( =0) (T
2
/ Hz)
10
-19
We note that the size of MC calculated magnetic field noise spectra differs from
the experimentally measured S B z (ω, T ) by three orders of magnitude. Since the
scaling from MC simulation to experimental mm size sample involves a volume
ratio of 10 16 , it is hardly surprising that the flux noise magnitudes detected are
different than expected by this amount. While finite size scaling of MC simulations
for DSI Hamiltonians has been done in the past [8], estimating the magnitude of
the flux noise to be expected for a mm-scale sample of Dy 2 Ti 2 O 7 is a challenge for
future MC simulations.
From the GR fits, it is found that the the power law of frequency for decay of
GR noise, i.e. b(T ) in S B (ω, T ) ∝ τ/(1 + (ωτ ) b ) is less than 2 for both experiment
and MC. The modified b(T ) suggests new physics that cannot be described by a
simple theory of free magnetic monopole plasma that has been derived so far [7].
We discuss implications of this revelation in the next chapter.
5 Analysis
Fig. 5.7 Top: Predicted
relationship from Dy 2 Ti 2 O 7
MC simulations of B Z (t), of
S Bz (0, T ) versus τ (T ) for the
GR fluctuations of a ±m ∗
magnetic charge plasma.
Note that all S Bz (0, T ) are
offset by a constant along the
y-axis due to artifacts of
Nyquist (sampling) noise at
the high frequency end of the
MC calculations. Bottom:
S (0, T ) plotted versus τ (T )
as measured from fitting data
in Fig. 5.1. Observation that
S (0, T ) ∝ τ (T ) for
Dy 2 Ti 2 O 7 throughout the full
temperature range is a key
expectation for ±m ∗ GR
magnetic-flux noise
0
0.5
1
1.5
2
2.5
(sec)
10
-3
0
0.2
0.4
0.6
0.8
1
S ( =0) (
0
2
/Hz)
10
-4
0
0.5
1
1.5
2
2.5
(sec)
10
-3
0.5
1
1.5
2
2.5
S
B
z
( =0) (T
2
/ Hz)
10
-19
We note that the size of MC calculated magnetic field noise spectra differs from
the experimentally measured S B z (ω, T ) by three orders of magnitude. Since the
scaling from MC simulation to experimental mm size sample involves a volume
ratio of 10 16 , it is hardly surprising that the flux noise magnitudes detected are
different than expected by this amount. While finite size scaling of MC simulations
for DSI Hamiltonians has been done in the past [8], estimating the magnitude of
the flux noise to be expected for a mm-scale sample of Dy 2 Ti 2 O 7 is a challenge for
future MC simulations.
From the GR fits, it is found that the the power law of frequency for decay of
GR noise, i.e. b(T ) in S B (ω, T ) ∝ τ/(1 + (ωτ ) b ) is less than 2 for both experiment
and MC. The modified b(T ) suggests new physics that cannot be described by a
simple theory of free magnetic monopole plasma that has been derived so far [7].
We discuss implications of this revelation in the next chapter.