

132
6 Detection of Radio Signals and Its Parameters Measuring
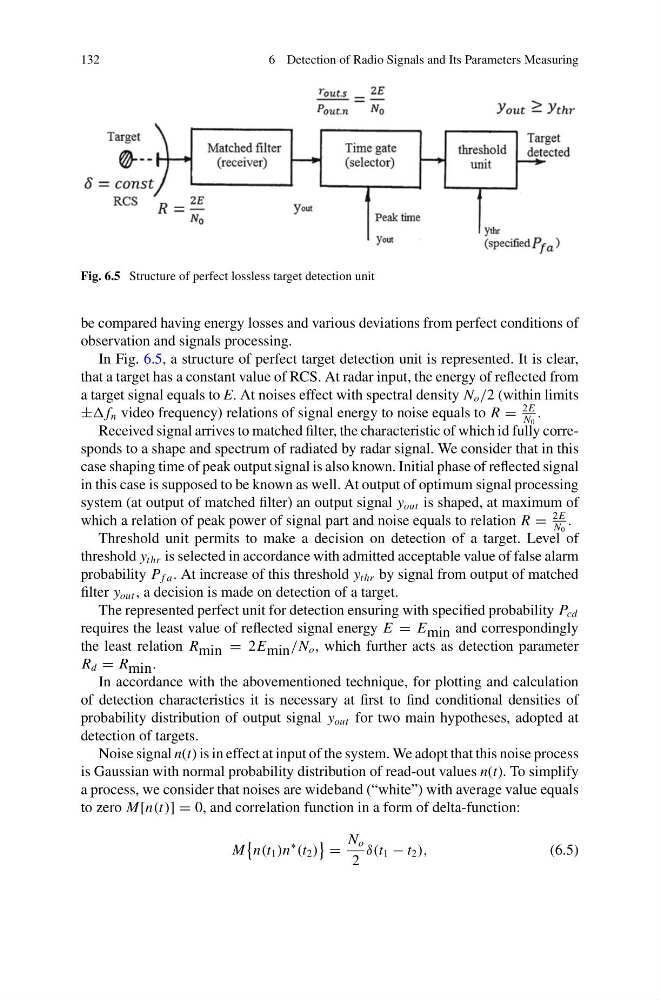
Fig. 6.5 Structure of perfect lossless target detection unit
be compared having energy losses and various deviations from perfect conditions of
observation and signals processing.
In Fig. 6.5, a structure of perfect target detection unit is represented. It is clear,
that a target has a constant value of RCS. At radar input, the energy of reflected from
a target signal equals to E. At noises effect with spectral density N o /2 (within limits
± f n video frequency) relations of signal energy to noise equals to R =
2E
N 0
.
Received signal arrives to matched filter, the characteristic of which id fully corresponds to a shape and spectrum of radiated by radar signal. We consider that in this
case shaping time of peak output signal is also known. Initial phase of reflected signal
in this case is supposed to be known as well. At output of optimum signal processing
system (at output of matched filter) an output signal y out is shaped, at maximum of
which a relation of peak power of signal part and noise equals to relation R =
2E
N 0
.
Threshold unit permits to make a decision on detection of a target. Level of
threshold y thr is selected in accordance with admitted acceptable value of false alarm
probability P f a . At increase of this threshold y thr by signal from output of matched
filter y out , a decision is made on detection of a target.
The represented perfect unit for detection ensuring with specified probability P cd
requires the least value of reflected signal energy E = E min and correspondingly
the least relation R min = 2E min /N o , which further acts as detection parameter
R d = R min .
In accordance with the abovementioned technique, for plotting and calculation
of detection characteristics it is necessary at first to find conditional densities of
probability distribution of output signal y out for two main hypotheses, adopted at
detection of targets.
Noise signal n(t) is in effect at input of the system. We adopt that this noise process
is Gaussian with normal probability distribution of read-out values n(t). To simplify
a process, we consider that noises are wideband (“white”) with average value equals
to zero M[n(t)] = 0, and correlation function in a form of delta-function:
M
n(t 1 )n
∗
(t 2 )
=
N o
2
δ(t 1 − t 2 ),
(6.5)
6 Detection of Radio Signals and Its Parameters Measuring
Fig. 6.5 Structure of perfect lossless target detection unit
be compared having energy losses and various deviations from perfect conditions of
observation and signals processing.
In Fig. 6.5, a structure of perfect target detection unit is represented. It is clear,
that a target has a constant value of RCS. At radar input, the energy of reflected from
a target signal equals to E. At noises effect with spectral density N o /2 (within limits
± f n video frequency) relations of signal energy to noise equals to R =
2E
N 0
.
Received signal arrives to matched filter, the characteristic of which id fully corresponds to a shape and spectrum of radiated by radar signal. We consider that in this
case shaping time of peak output signal is also known. Initial phase of reflected signal
in this case is supposed to be known as well. At output of optimum signal processing
system (at output of matched filter) an output signal y out is shaped, at maximum of
which a relation of peak power of signal part and noise equals to relation R =
2E
N 0
.
Threshold unit permits to make a decision on detection of a target. Level of
threshold y thr is selected in accordance with admitted acceptable value of false alarm
probability P f a . At increase of this threshold y thr by signal from output of matched
filter y out , a decision is made on detection of a target.
The represented perfect unit for detection ensuring with specified probability P cd
requires the least value of reflected signal energy E = E min and correspondingly
the least relation R min = 2E min /N o , which further acts as detection parameter
R d = R min .
In accordance with the abovementioned technique, for plotting and calculation
of detection characteristics it is necessary at first to find conditional densities of
probability distribution of output signal y out for two main hypotheses, adopted at
detection of targets.
Noise signal n(t) is in effect at input of the system. We adopt that this noise process
is Gaussian with normal probability distribution of read-out values n(t). To simplify
a process, we consider that noises are wideband (“white”) with average value equals
to zero M[n(t)] = 0, and correlation function in a form of delta-function:
M
n(t 1 )n
∗
(t 2 )
=
N o
2
δ(t 1 − t 2 ),
(6.5)