

R t
ð Þ ¼ 1:033
E 0
ρ 0
1
5
t
2
5 :
ð5:24Þ
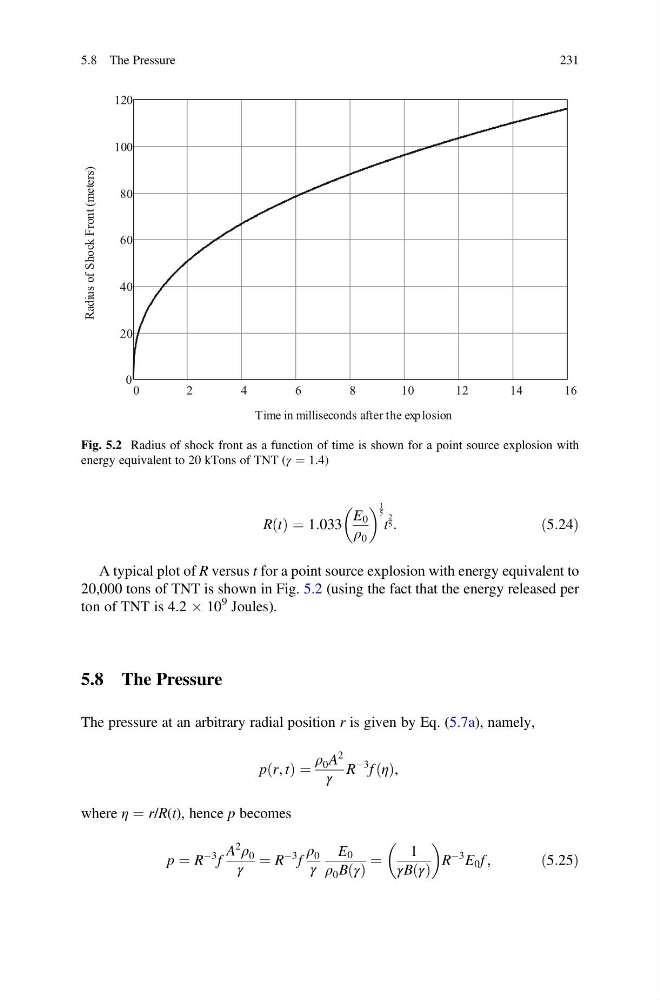
A typical plot of R versus t for a point source explosion with energy equivalent to
20,000 tons of TNT is shown in Fig. 5.2 (using the fact that the energy released per
ton of TNT is 4.2 Â 10
9 Joules).
5.8 The Pressure
The pressure at an arbitrary radial position r is given by Eq. (5.7a), namely,
p r, t
ð Þ ¼
ρ 0 A
2
γ
R
À3 f η
ð Þ,
where η ¼ r/R(t), hence p becomes
p ¼ R
À3 f
A
2
ρ 0
γ
¼ R
À3 f
ρ 0
γ
E 0
ρ 0 B γ
ð Þ
¼
1
γB γ
ð Þ
R
À3 E 0 f ,
ð5:25Þ
0
2
4
6
8
10
12
14
16
0
20
40
60
80
100
120
Time in milliseconds after the explosion
Radius of Shock Front (meters)
Fig. 5.2 Radius of shock front as a function of time is shown for a point source explosion with
energy equivalent to 20 kTons of TNT (γ ¼ 1.4)
5.8 The Pressure
231
ð Þ ¼ 1:033
E 0
ρ 0
1
5
t
2
5 :
ð5:24Þ
A typical plot of R versus t for a point source explosion with energy equivalent to
20,000 tons of TNT is shown in Fig. 5.2 (using the fact that the energy released per
ton of TNT is 4.2 Â 10
9 Joules).
5.8 The Pressure
The pressure at an arbitrary radial position r is given by Eq. (5.7a), namely,
p r, t
ð Þ ¼
ρ 0 A
2
γ
R
À3 f η
ð Þ,
where η ¼ r/R(t), hence p becomes
p ¼ R
À3 f
A
2
ρ 0
γ
¼ R
À3 f
ρ 0
γ
E 0
ρ 0 B γ
ð Þ
¼
1
γB γ
ð Þ
R
À3 E 0 f ,
ð5:25Þ
0
2
4
6
8
10
12
14
16
0
20
40
60
80
100
120
Time in milliseconds after the explosion
Radius of Shock Front (meters)
Fig. 5.2 Radius of shock front as a function of time is shown for a point source explosion with
energy equivalent to 20 kTons of TNT (γ ¼ 1.4)
5.8 The Pressure
231