

approximately 1% of the sound speed but, nonetheless, represents a very loud sound
wave in terms of acoustic intensity (see Sect. 1.9, Chap. 1); thereafter, u m will be
increased in increments to about 10% of the sound speed.
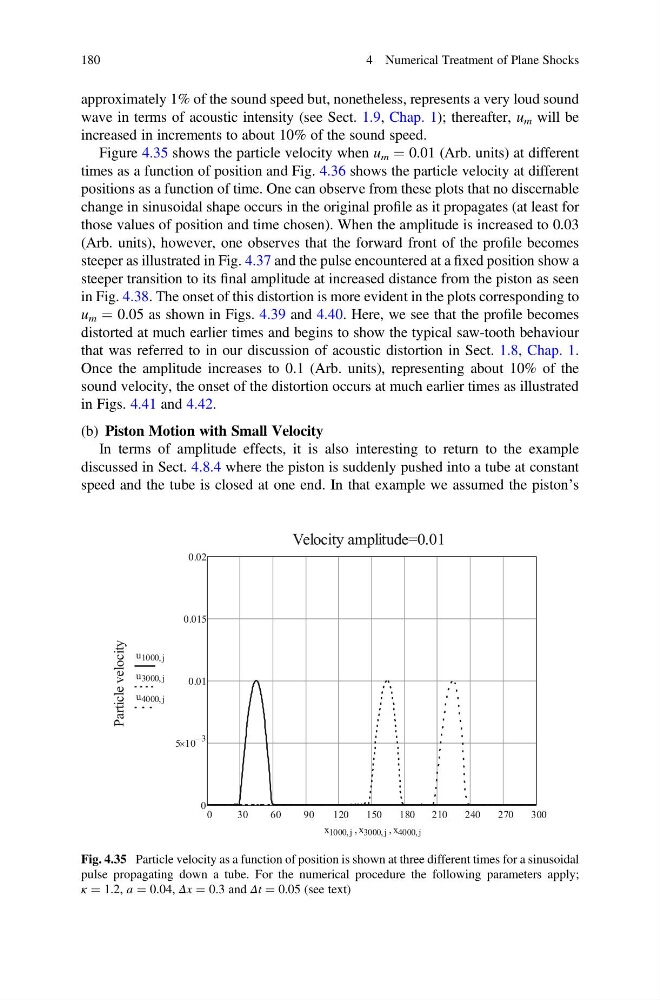
Figure 4.35 shows the particle velocity when u m ¼ 0.01 (Arb. units) at different
times as a function of position and Fig. 4.36 shows the particle velocity at different
positions as a function of time. One can observe from these plots that no discernable
change in sinusoidal shape occurs in the original profile as it propagates (at least for
those values of position and time chosen). When the amplitude is increased to 0.03
(Arb. units), however, one observes that the forward front of the profile becomes
steeper as illustrated in Fig. 4.37 and the pulse encountered at a fixed position show a
steeper transition to its final amplitude at increased distance from the piston as seen
in Fig. 4.38. The onset of this distortion is more evident in the plots corresponding to
u m ¼ 0.05 as shown in Figs. 4.39 and 4.40. Here, we see that the profile becomes
distorted at much earlier times and begins to show the typical saw-tooth behaviour
that was referred to in our discussion of acoustic distortion in Sect. 1.8, Chap. 1.
Once the amplitude increases to 0.1 (Arb. units), representing about 10% of the
sound velocity, the onset of the distortion occurs at much earlier times as illustrated
in Figs. 4.41 and 4.42.
(b) Piston Motion with Small Velocity
In terms of amplitude effects, it is also interesting to return to the example
discussed in Sect. 4.8.4 where the piston is suddenly pushed into a tube at constant
speed and the tube is closed at one end. In that example we assumed the piston’s
Fig. 4.35 Particle velocity as a function of position is shown at three different times for a sinusoidal
pulse propagating down a tube. For the numerical procedure the following parameters apply;
κ ¼ 1.2, a ¼ 0.04, Δx ¼ 0.3 and Δt ¼ 0.05 (see text)
180
4 Numerical Treatment of Plane Shocks
wave in terms of acoustic intensity (see Sect. 1.9, Chap. 1); thereafter, u m will be
increased in increments to about 10% of the sound speed.
Figure 4.35 shows the particle velocity when u m ¼ 0.01 (Arb. units) at different
times as a function of position and Fig. 4.36 shows the particle velocity at different
positions as a function of time. One can observe from these plots that no discernable
change in sinusoidal shape occurs in the original profile as it propagates (at least for
those values of position and time chosen). When the amplitude is increased to 0.03
(Arb. units), however, one observes that the forward front of the profile becomes
steeper as illustrated in Fig. 4.37 and the pulse encountered at a fixed position show a
steeper transition to its final amplitude at increased distance from the piston as seen
in Fig. 4.38. The onset of this distortion is more evident in the plots corresponding to
u m ¼ 0.05 as shown in Figs. 4.39 and 4.40. Here, we see that the profile becomes
distorted at much earlier times and begins to show the typical saw-tooth behaviour
that was referred to in our discussion of acoustic distortion in Sect. 1.8, Chap. 1.
Once the amplitude increases to 0.1 (Arb. units), representing about 10% of the
sound velocity, the onset of the distortion occurs at much earlier times as illustrated
in Figs. 4.41 and 4.42.
(b) Piston Motion with Small Velocity
In terms of amplitude effects, it is also interesting to return to the example
discussed in Sect. 4.8.4 where the piston is suddenly pushed into a tube at constant
speed and the tube is closed at one end. In that example we assumed the piston’s
Fig. 4.35 Particle velocity as a function of position is shown at three different times for a sinusoidal
pulse propagating down a tube. For the numerical procedure the following parameters apply;
κ ¼ 1.2, a ¼ 0.04, Δx ¼ 0.3 and Δt ¼ 0.05 (see text)
180
4 Numerical Treatment of Plane Shocks