

p
p 0
¼ 1 þ
γu
c 2
0
γÀ1
2
À Á
uU s þ c
2
0
U s À u
"
#
:
Similar profiles of pressure and density ratios can be plotted by using these
equations, and the numerical results for the pressure and density behind the shock
are found to be in agreement with the values given by Eqs. (3.25) and (3.28).
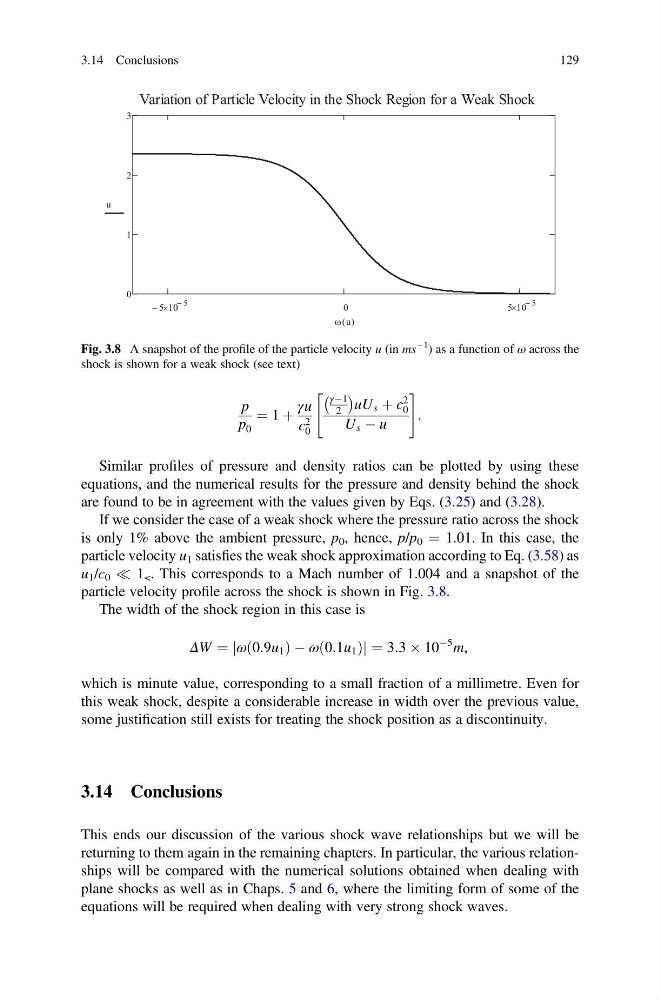
If we consider the case of a weak shock where the pressure ratio across the shock
is only 1% above the ambient pressure, p 0 , hence, p/p 0 ¼ 1.01. In this case, the
particle velocity u 1 satisfies the weak shock approximation according to Eq. (3.58) as
u 1 /c 0 ( 1 < . This corresponds to a Mach number of 1.004 and a snapshot of the
particle velocity profile across the shock is shown in Fig. 3.8.
The width of the shock region in this case is
ΔW ¼ ω 0:9u 1
ð
ÞÀω 0:1u 1
ð
Þ
j
j ¼ 3:3 Â 10
À5 m,
which is minute value, corresponding to a small fraction of a millimetre. Even for
this weak shock, despite a considerable increase in width over the previous value,
some justification still exists for treating the shock position as a discontinuity.
3.14 Conclusions
This ends our discussion of the various shock wave relationships but we will be
returning to them again in the remaining chapters. In particular, the various relationships will be compared with the numerical solutions obtained when dealing with
plane shocks as well as in Chaps. 5 and 6, where the limiting form of some of the
equations will be required when dealing with very strong shock waves.
Fig. 3.8 A snapshot of the profile of the particle velocity u (in ms
À1
) as a function of ω across the
shock is shown for a weak shock (see text)
3.14 Conclusions
129
p 0
¼ 1 þ
γu
c 2
0
γÀ1
2
À Á
uU s þ c
2
0
U s À u
"
#
:
Similar profiles of pressure and density ratios can be plotted by using these
equations, and the numerical results for the pressure and density behind the shock
are found to be in agreement with the values given by Eqs. (3.25) and (3.28).
If we consider the case of a weak shock where the pressure ratio across the shock
is only 1% above the ambient pressure, p 0 , hence, p/p 0 ¼ 1.01. In this case, the
particle velocity u 1 satisfies the weak shock approximation according to Eq. (3.58) as
u 1 /c 0 ( 1 < . This corresponds to a Mach number of 1.004 and a snapshot of the
particle velocity profile across the shock is shown in Fig. 3.8.
The width of the shock region in this case is
ΔW ¼ ω 0:9u 1
ð
ÞÀω 0:1u 1
ð
Þ
j
j ¼ 3:3 Â 10
À5 m,
which is minute value, corresponding to a small fraction of a millimetre. Even for
this weak shock, despite a considerable increase in width over the previous value,
some justification still exists for treating the shock position as a discontinuity.
3.14 Conclusions
This ends our discussion of the various shock wave relationships but we will be
returning to them again in the remaining chapters. In particular, the various relationships will be compared with the numerical solutions obtained when dealing with
plane shocks as well as in Chaps. 5 and 6, where the limiting form of some of the
equations will be required when dealing with very strong shock waves.
Fig. 3.8 A snapshot of the profile of the particle velocity u (in ms
À1
) as a function of ω across the
shock is shown for a weak shock (see text)
3.14 Conclusions
129