

Elements of Modern Physics
56
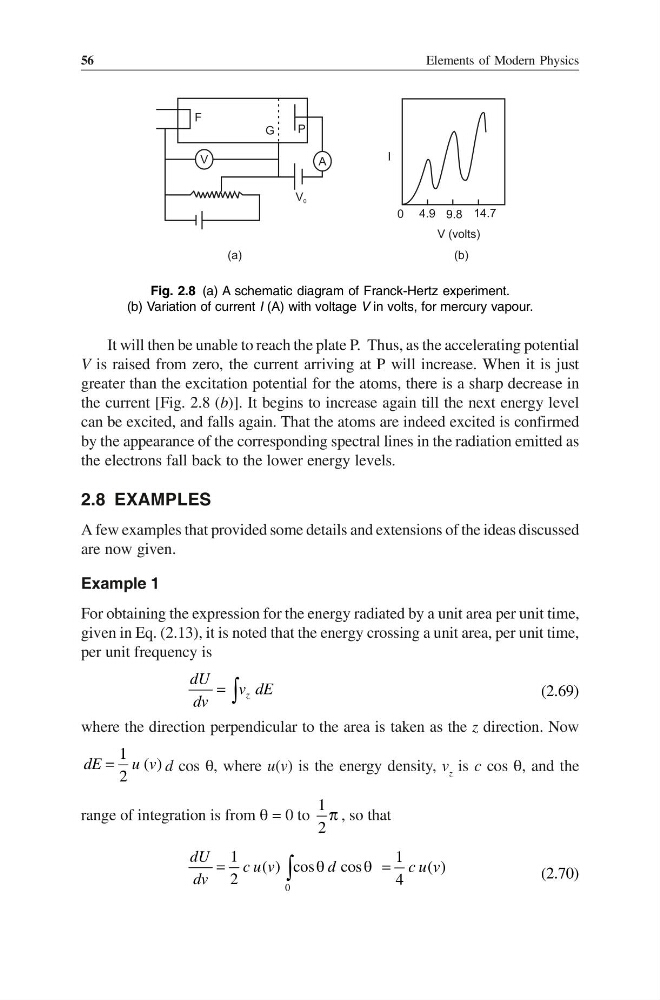
Fig. 2.8 (a) A schematic diagram of Franck-Hertz experiment.
(b) Variation of current I (A) with voltage V in volts, for mercury vapour.
It will then be unable to reach the plate P. Thus, as the accelerating potential
V is raised from zero, the current arriving at P will increase. When it is just
greater than the excitation potential for the atoms, there is a sharp decrease in
the current [Fig. 2.8 (b)]. It begins to increase again till the next energy level
can be excited, and falls again. That the atoms are indeed excited is confirmed
by the appearance of the corresponding spectral lines in the radiation emitted as
the electrons fall back to the lower energy levels.
2.8 EXAMPLES
A few examples that provided some details and extensions of the ideas discussed
are now given.
Example 1
For obtaining the expression for the energy radiated by a unit area per unit time,
given in Eq. (2.13), it is noted that the energy crossing a unit area, per unit time,
per unit frequency is
= ∫ z
dU
v dE
dv
(2.69)
where the direction perpendicular to the area is taken as the z direction. Now
1 ( )
2
=
dE
u v d cos θ, where u(v) is the energy density, v z is c cos θ, and the
range of integration is from θ = 0 to
1
2
π , so that
0
1
( ) cos
cos
2
=
θ
θ
∫
dU
c u v
d
dv
1 ( )
4
= c u v
(2.70)
56
Fig. 2.8 (a) A schematic diagram of Franck-Hertz experiment.
(b) Variation of current I (A) with voltage V in volts, for mercury vapour.
It will then be unable to reach the plate P. Thus, as the accelerating potential
V is raised from zero, the current arriving at P will increase. When it is just
greater than the excitation potential for the atoms, there is a sharp decrease in
the current [Fig. 2.8 (b)]. It begins to increase again till the next energy level
can be excited, and falls again. That the atoms are indeed excited is confirmed
by the appearance of the corresponding spectral lines in the radiation emitted as
the electrons fall back to the lower energy levels.
2.8 EXAMPLES
A few examples that provided some details and extensions of the ideas discussed
are now given.
Example 1
For obtaining the expression for the energy radiated by a unit area per unit time,
given in Eq. (2.13), it is noted that the energy crossing a unit area, per unit time,
per unit frequency is
= ∫ z
dU
v dE
dv
(2.69)
where the direction perpendicular to the area is taken as the z direction. Now
1 ( )
2
=
dE
u v d cos θ, where u(v) is the energy density, v z is c cos θ, and the
range of integration is from θ = 0 to
1
2
π , so that
0
1
( ) cos
cos
2
=
θ
θ
∫
dU
c u v
d
dv
1 ( )
4
= c u v
(2.70)