

An Automatic Sound ClassifiCation Framework …
431
3.5 Robustness to Noise
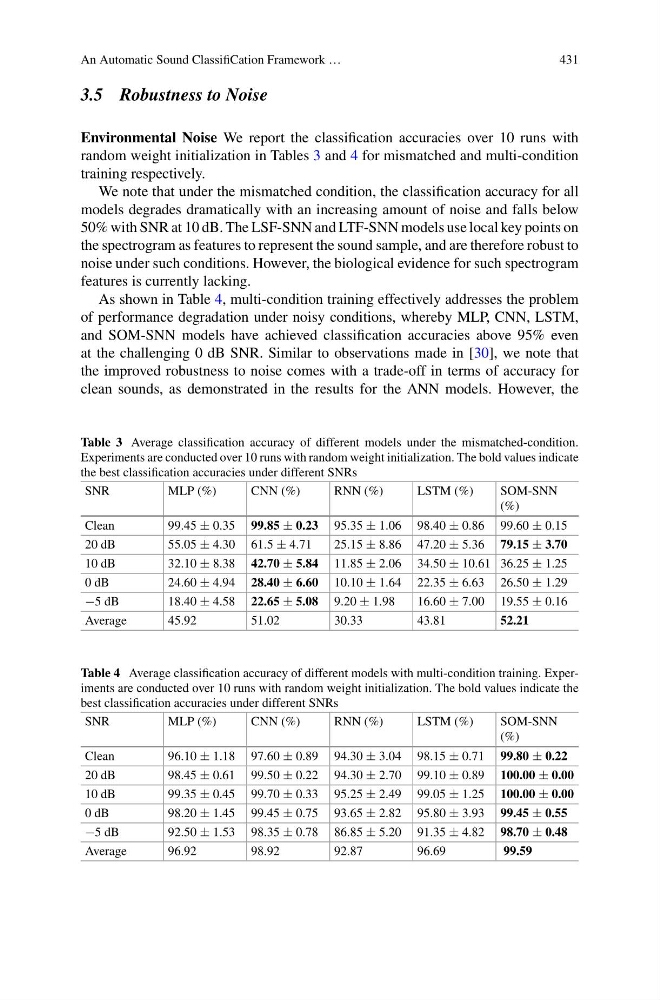
Environmental Noise We report the classification accuracies over 10 runs with
random weight initialization in Tables 3 and 4 for mismatched and multi-condition
training respectively.
We note that under the mismatched condition, the classification accuracy for all
models degrades dramatically with an increasing amount of noise and falls below
50% with SNR at 10 dB. The LSF-SNN and LTF-SNN models use local key points on
the spectrogram as features to represent the sound sample, and are therefore robust to
noise under such conditions. However, the biological evidence for such spectrogram
features is currently lacking.
As shown in Table 4, multi-condition training effectively addresses the problem
of performance degradation under noisy conditions, whereby MLP, CNN, LSTM,
and SOM-SNN models have achieved classification accuracies above 95% even
at the challenging 0 dB SNR. Similar to observations made in [30], we note that
the improved robustness to noise comes with a trade-off in terms of accuracy for
clean sounds, as demonstrated in the results for the ANN models. However, the
Table 3 Average classification accuracy of different models under the mismatched-condition.
Experiments are conducted over 10 runs with random weight initialization. The bold values indicate
the best classification accuracies under different SNRs
SNR
MLP (%)
CNN (%)
RNN (%)
LSTM (%)
SOM-SNN
(%)
Clean
99.45 ± 0.35 99.85 ± 0.23 95.35 ± 1.06 98.40 ± 0.86 99.60 ± 0.15
20 dB
55.05 ± 4.30 61.5 ± 4.71
25.15 ± 8.86 47.20 ± 5.36 79.15 ± 3.70
10 dB
32.10 ± 8.38 42.70 ± 5.84 11.85 ± 2.06 34.50 ± 10.61 36.25 ± 1.25
0 dB
24.60 ± 4.94 28.40 ± 6.60 10.10 ± 1.64 22.35 ± 6.63 26.50 ± 1.29
−5 dB
18.40 ± 4.58 22.65 ± 5.08 9.20 ± 1.98
16.60 ± 7.00 19.55 ± 0.16
Average
45.92
51.02
30.33
43.81
52.21
Table 4 Average classification accuracy of different models with multi-condition training. Experiments are conducted over 10 runs with random weight initialization. The bold values indicate the
best classification accuracies under different SNRs
SNR
MLP (%)
CNN (%)
RNN (%)
LSTM (%)
SOM-SNN
(%)
Clean
96.10 ± 1.18 97.60 ± 0.89 94.30 ± 3.04 98.15 ± 0.71 99.80 ± 0.22
20 dB
98.45 ± 0.61 99.50 ± 0.22 94.30 ± 2.70 99.10 ± 0.89 100.00 ± 0.00
10 dB
99.35 ± 0.45 99.70 ± 0.33 95.25 ± 2.49 99.05 ± 1.25 100.00 ± 0.00
0 dB
98.20 ± 1.45 99.45 ± 0.75 93.65 ± 2.82 95.80 ± 3.93 99.45 ± 0.55
−5 dB
92.50 ± 1.53 98.35 ± 0.78 86.85 ± 5.20 91.35 ± 4.82 98.70 ± 0.48
Average
96.92
98.92
92.87
96.69
99.59
431
3.5 Robustness to Noise
Environmental Noise We report the classification accuracies over 10 runs with
random weight initialization in Tables 3 and 4 for mismatched and multi-condition
training respectively.
We note that under the mismatched condition, the classification accuracy for all
models degrades dramatically with an increasing amount of noise and falls below
50% with SNR at 10 dB. The LSF-SNN and LTF-SNN models use local key points on
the spectrogram as features to represent the sound sample, and are therefore robust to
noise under such conditions. However, the biological evidence for such spectrogram
features is currently lacking.
As shown in Table 4, multi-condition training effectively addresses the problem
of performance degradation under noisy conditions, whereby MLP, CNN, LSTM,
and SOM-SNN models have achieved classification accuracies above 95% even
at the challenging 0 dB SNR. Similar to observations made in [30], we note that
the improved robustness to noise comes with a trade-off in terms of accuracy for
clean sounds, as demonstrated in the results for the ANN models. However, the
Table 3 Average classification accuracy of different models under the mismatched-condition.
Experiments are conducted over 10 runs with random weight initialization. The bold values indicate
the best classification accuracies under different SNRs
SNR
MLP (%)
CNN (%)
RNN (%)
LSTM (%)
SOM-SNN
(%)
Clean
99.45 ± 0.35 99.85 ± 0.23 95.35 ± 1.06 98.40 ± 0.86 99.60 ± 0.15
20 dB
55.05 ± 4.30 61.5 ± 4.71
25.15 ± 8.86 47.20 ± 5.36 79.15 ± 3.70
10 dB
32.10 ± 8.38 42.70 ± 5.84 11.85 ± 2.06 34.50 ± 10.61 36.25 ± 1.25
0 dB
24.60 ± 4.94 28.40 ± 6.60 10.10 ± 1.64 22.35 ± 6.63 26.50 ± 1.29
−5 dB
18.40 ± 4.58 22.65 ± 5.08 9.20 ± 1.98
16.60 ± 7.00 19.55 ± 0.16
Average
45.92
51.02
30.33
43.81
52.21
Table 4 Average classification accuracy of different models with multi-condition training. Experiments are conducted over 10 runs with random weight initialization. The bold values indicate the
best classification accuracies under different SNRs
SNR
MLP (%)
CNN (%)
RNN (%)
LSTM (%)
SOM-SNN
(%)
Clean
96.10 ± 1.18 97.60 ± 0.89 94.30 ± 3.04 98.15 ± 0.71 99.80 ± 0.22
20 dB
98.45 ± 0.61 99.50 ± 0.22 94.30 ± 2.70 99.10 ± 0.89 100.00 ± 0.00
10 dB
99.35 ± 0.45 99.70 ± 0.33 95.25 ± 2.49 99.05 ± 1.25 100.00 ± 0.00
0 dB
98.20 ± 1.45 99.45 ± 0.75 93.65 ± 2.82 95.80 ± 3.93 99.45 ± 0.55
−5 dB
92.50 ± 1.53 98.35 ± 0.78 86.85 ± 5.20 91.35 ± 4.82 98.70 ± 0.48
Average
96.92
98.92
92.87
96.69
99.59