

RRAM Device Characterizations and Modelling
359
-3
-2
-1
0
10
-10
10
-9
10
-8
10
-7
10
-6
10
-5
10
-4
D
C
B
Current(A)
Voltage(V)
RESET
A
(a)
0
1
2
3
C
B
D
Voltage(V)
SET
(b)
A
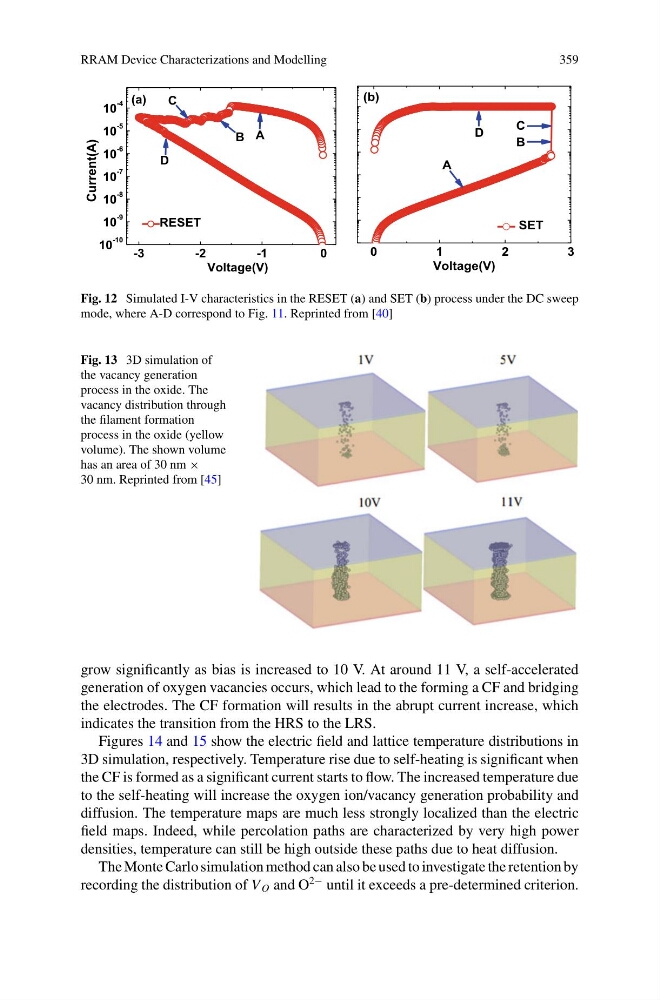
Fig. 12 Simulated I-V characteristics in the RESET (a) and SET (b) process under the DC sweep
mode, where A-D correspond to Fig. 11. Reprinted from [40]
Fig. 13 3D simulation of
the vacancy generation
process in the oxide. The
vacancy distribution through
the filament formation
process in the oxide (yellow
volume). The shown volume
has an area of 30 nm ×
30 nm. Reprinted from [45]
grow significantly as bias is increased to 10 V. At around 11 V, a self-accelerated
generation of oxygen vacancies occurs, which lead to the forming a CF and bridging
the electrodes. The CF formation will results in the abrupt current increase, which
indicates the transition from the HRS to the LRS.
Figures 14 and 15 show the electric field and lattice temperature distributions in
3D simulation, respectively. Temperature rise due to self-heating is significant when
the CF is formed as a significant current starts to flow. The increased temperature due
to the self-heating will increase the oxygen ion/vacancy generation probability and
diffusion. The temperature maps are much less strongly localized than the electric
field maps. Indeed, while percolation paths are characterized by very high power
densities, temperature can still be high outside these paths due to heat diffusion.
The Monte Carlo simulation method can also be used to investigate the retention by
recording the distribution of V O and O
2− until it exceeds a pre-determined criterion.
359
-3
-2
-1
0
10
-10
10
-9
10
-8
10
-7
10
-6
10
-5
10
-4
D
C
B
Current(A)
Voltage(V)
RESET
A
(a)
0
1
2
3
C
B
D
Voltage(V)
SET
(b)
A
Fig. 12 Simulated I-V characteristics in the RESET (a) and SET (b) process under the DC sweep
mode, where A-D correspond to Fig. 11. Reprinted from [40]
Fig. 13 3D simulation of
the vacancy generation
process in the oxide. The
vacancy distribution through
the filament formation
process in the oxide (yellow
volume). The shown volume
has an area of 30 nm ×
30 nm. Reprinted from [45]
grow significantly as bias is increased to 10 V. At around 11 V, a self-accelerated
generation of oxygen vacancies occurs, which lead to the forming a CF and bridging
the electrodes. The CF formation will results in the abrupt current increase, which
indicates the transition from the HRS to the LRS.
Figures 14 and 15 show the electric field and lattice temperature distributions in
3D simulation, respectively. Temperature rise due to self-heating is significant when
the CF is formed as a significant current starts to flow. The increased temperature due
to the self-heating will increase the oxygen ion/vacancy generation probability and
diffusion. The temperature maps are much less strongly localized than the electric
field maps. Indeed, while percolation paths are characterized by very high power
densities, temperature can still be high outside these paths due to heat diffusion.
The Monte Carlo simulation method can also be used to investigate the retention by
recording the distribution of V O and O
2− until it exceeds a pre-determined criterion.