

Microwave Oscillators and Detectors Based …
21
6.2.1 Impact of 1/f Frequency Noise on Linewidth
Keller et al. [75] showed an additional mechanism of linewidth broadening that arises
from the so-called 1/f frequency noise or color noise. They obtained a frequency noise
spectrum spanning more than five decades of Fourier frequencies and showed that
the frequency noise spectrum is white at large Fourier frequencies and varies as 1/f
at small Fourier frequencies. They showed that 1/f frequency noise can causes both
broadening and a change in shape of the oscillator’s spectral line as the measurement
time increases. The 1/f frequency noise was observed in other types of STNOs [75,
102, 103] as well as in MTJ-based STNOs [88, 104].
In general, the STNO waveform is a nonideal sinusoidal waveform where instantaneous frequency/phase and amplitude varies as a function of time. Keller et al. [75,
102] measured the phase noise using the zero crossover method. The phase noise is
calculated from the power spectral density of the phase deviations, which is calculated using the equation, φ tot = 2π f 0 t + φ(t) = nπ . Here, φ tot is the total phase, f 0
is the nominal frequency, and φ(t) is the phase deviation. Following this method, the
frequency noise can simply be calculated using the Fourier relation S
2
ν = f
2 S
2
φ [88,
102]. Here, S ν is the frequency noise (power spectral density of instantaneous frequency deviation) and S φ is the phase noise (power spectral density of instantaneous
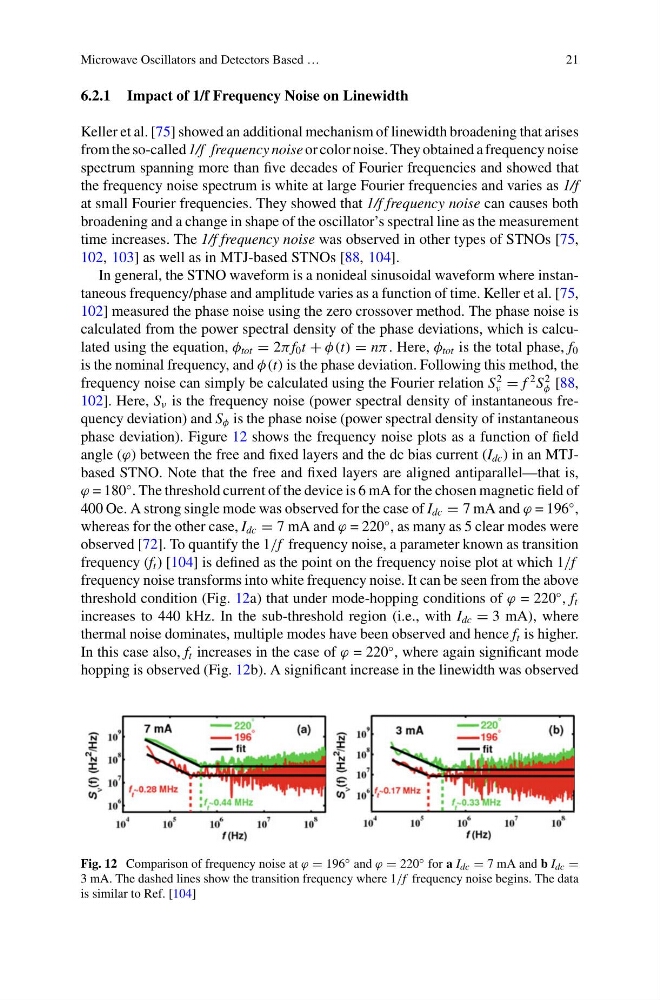
phase deviation). Figure 12 shows the frequency noise plots as a function of field
angle (ϕ) between the free and fixed layers and the dc bias current (I dc ) in an MTJbased STNO. Note that the free and fixed layers are aligned antiparallel—that is,
ϕ = 180
◦ . The threshold current of the device is 6 mA for the chosen magnetic field of
400 Oe. A strong single mode was observed for the case of I dc = 7 mA and ϕ = 196
◦ ,
whereas for the other case, I dc = 7 mA and ϕ = 220
◦ , as many as 5 clear modes were
observed [72]. To quantify the 1/f frequency noise, a parameter known as transition
frequency (f t ) [104] is defined as the point on the frequency noise plot at which 1/f
frequency noise transforms into white frequency noise. It can be seen from the above
threshold condition (Fig. 12a) that under mode-hopping conditions of ϕ = 220
◦ , f t
increases to 440 kHz. In the sub-threshold region (i.e., with I dc = 3 mA), where
thermal noise dominates, multiple modes have been observed and hence f t is higher.
In this case also, f t increases in the case of ϕ = 220
◦ , where again significant mode
hopping is observed (Fig. 12b). A significant increase in the linewidth was observed
Fig. 12 Comparison of frequency noise at ϕ = 196 ◦ and ϕ = 220 ◦ for a I dc = 7 mA and b I dc =
3 mA. The dashed lines show the transition frequency where 1/f frequency noise begins. The data
is similar to Ref. [104]
21
6.2.1 Impact of 1/f Frequency Noise on Linewidth
Keller et al. [75] showed an additional mechanism of linewidth broadening that arises
from the so-called 1/f frequency noise or color noise. They obtained a frequency noise
spectrum spanning more than five decades of Fourier frequencies and showed that
the frequency noise spectrum is white at large Fourier frequencies and varies as 1/f
at small Fourier frequencies. They showed that 1/f frequency noise can causes both
broadening and a change in shape of the oscillator’s spectral line as the measurement
time increases. The 1/f frequency noise was observed in other types of STNOs [75,
102, 103] as well as in MTJ-based STNOs [88, 104].
In general, the STNO waveform is a nonideal sinusoidal waveform where instantaneous frequency/phase and amplitude varies as a function of time. Keller et al. [75,
102] measured the phase noise using the zero crossover method. The phase noise is
calculated from the power spectral density of the phase deviations, which is calculated using the equation, φ tot = 2π f 0 t + φ(t) = nπ . Here, φ tot is the total phase, f 0
is the nominal frequency, and φ(t) is the phase deviation. Following this method, the
frequency noise can simply be calculated using the Fourier relation S
2
ν = f
2 S
2
φ [88,
102]. Here, S ν is the frequency noise (power spectral density of instantaneous frequency deviation) and S φ is the phase noise (power spectral density of instantaneous
phase deviation). Figure 12 shows the frequency noise plots as a function of field
angle (ϕ) between the free and fixed layers and the dc bias current (I dc ) in an MTJbased STNO. Note that the free and fixed layers are aligned antiparallel—that is,
ϕ = 180
◦ . The threshold current of the device is 6 mA for the chosen magnetic field of
400 Oe. A strong single mode was observed for the case of I dc = 7 mA and ϕ = 196
◦ ,
whereas for the other case, I dc = 7 mA and ϕ = 220
◦ , as many as 5 clear modes were
observed [72]. To quantify the 1/f frequency noise, a parameter known as transition
frequency (f t ) [104] is defined as the point on the frequency noise plot at which 1/f
frequency noise transforms into white frequency noise. It can be seen from the above
threshold condition (Fig. 12a) that under mode-hopping conditions of ϕ = 220
◦ , f t
increases to 440 kHz. In the sub-threshold region (i.e., with I dc = 3 mA), where
thermal noise dominates, multiple modes have been observed and hence f t is higher.
In this case also, f t increases in the case of ϕ = 220
◦ , where again significant mode
hopping is observed (Fig. 12b). A significant increase in the linewidth was observed
Fig. 12 Comparison of frequency noise at ϕ = 196 ◦ and ϕ = 220 ◦ for a I dc = 7 mA and b I dc =
3 mA. The dashed lines show the transition frequency where 1/f frequency noise begins. The data
is similar to Ref. [104]