

Microwave Oscillators and Detectors Based …
19
ν > 0, emission linewidth could be dependent on the temperature in different ways.
For the case of 2ππf << < p , emission linewidth shows a linear dependency on the
temperature, whereas for the case of 2ππf > > p , the emission linewidth increases
nonlinearly with the temperature in good agreement with theoretical predictions
[14, 66].
6.2 Multimode Excitation and Mode-Hopping
In the previous section, the analytic theory of linewidth generation was based on the
single auto-oscillatory mode. However, various studies have shown the presence of
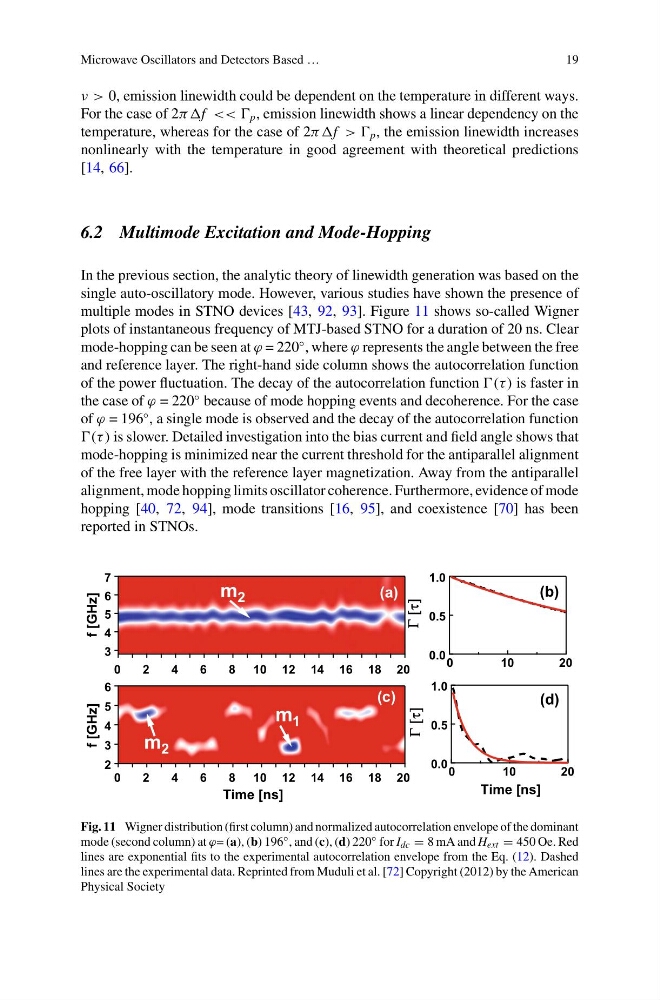
multiple modes in STNO devices [43, 92, 93]. Figure 11 shows so-called Wigner
plots of instantaneous frequency of MTJ-based STNO for a duration of 20 ns. Clear
mode-hopping can be seen at ϕ = 220
◦ , where ϕ represents the angle between the free
and reference layer. The right-hand side column shows the autocorrelation function
of the power fluctuation. The decay of the autocorrelation function (τ ) is faster in
the case of ϕ = 220
◦ because of mode hopping events and decoherence. For the case
of ϕ = 196
◦ , a single mode is observed and the decay of the autocorrelation function
(τ ) is slower. Detailed investigation into the bias current and field angle shows that
mode-hopping is minimized near the current threshold for the antiparallel alignment
of the free layer with the reference layer magnetization. Away from the antiparallel
alignment, mode hopping limits oscillator coherence. Furthermore, evidence of mode
hopping [40, 72, 94], mode transitions [16, 95], and coexistence [70] has been
reported in STNOs.
7
6
5
4
3
f [GHz]
20
18
16
14
12
10
8
6
4
2
0
(a)
m 2
6
5
4
3
2
f [GHz]
20
18
16
14
12
10
8
6
4
2
0
Time [ns]
m 2
m 1
1.0
0.5
0.0
20
10
0
(b)
1.0
0.5
0.0
20
10
0
Time [ns]
(d)
(c)
Fig. 11 Wigner distribution (first column) and normalized autocorrelation envelope of the dominant
mode (second column) at ϕ= (a), (b) 196 ◦ , and (c), (d) 220 ◦ for I dc = 8 mA and H ext = 450 Oe. Red
lines are exponential fits to the experimental autocorrelation envelope from the Eq. (12). Dashed
lines are the experimental data. Reprinted from Muduli et al. [72] Copyright (2012) by the American
Physical Society
19
ν > 0, emission linewidth could be dependent on the temperature in different ways.
For the case of 2ππf << < p , emission linewidth shows a linear dependency on the
temperature, whereas for the case of 2ππf > > p , the emission linewidth increases
nonlinearly with the temperature in good agreement with theoretical predictions
[14, 66].
6.2 Multimode Excitation and Mode-Hopping
In the previous section, the analytic theory of linewidth generation was based on the
single auto-oscillatory mode. However, various studies have shown the presence of
multiple modes in STNO devices [43, 92, 93]. Figure 11 shows so-called Wigner
plots of instantaneous frequency of MTJ-based STNO for a duration of 20 ns. Clear
mode-hopping can be seen at ϕ = 220
◦ , where ϕ represents the angle between the free
and reference layer. The right-hand side column shows the autocorrelation function
of the power fluctuation. The decay of the autocorrelation function (τ ) is faster in
the case of ϕ = 220
◦ because of mode hopping events and decoherence. For the case
of ϕ = 196
◦ , a single mode is observed and the decay of the autocorrelation function
(τ ) is slower. Detailed investigation into the bias current and field angle shows that
mode-hopping is minimized near the current threshold for the antiparallel alignment
of the free layer with the reference layer magnetization. Away from the antiparallel
alignment, mode hopping limits oscillator coherence. Furthermore, evidence of mode
hopping [40, 72, 94], mode transitions [16, 95], and coexistence [70] has been
reported in STNOs.
7
6
5
4
3
f [GHz]
20
18
16
14
12
10
8
6
4
2
0
(a)
m 2
6
5
4
3
2
f [GHz]
20
18
16
14
12
10
8
6
4
2
0
Time [ns]
m 2
m 1
1.0
0.5
0.0
20
10
0
(b)
1.0
0.5
0.0
20
10
0
Time [ns]
(d)
(c)
Fig. 11 Wigner distribution (first column) and normalized autocorrelation envelope of the dominant
mode (second column) at ϕ= (a), (b) 196 ◦ , and (c), (d) 220 ◦ for I dc = 8 mA and H ext = 450 Oe. Red
lines are exponential fits to the experimental autocorrelation envelope from the Eq. (12). Dashed
lines are the experimental data. Reprinted from Muduli et al. [72] Copyright (2012) by the American
Physical Society