

18
P. K. Muduli et al.
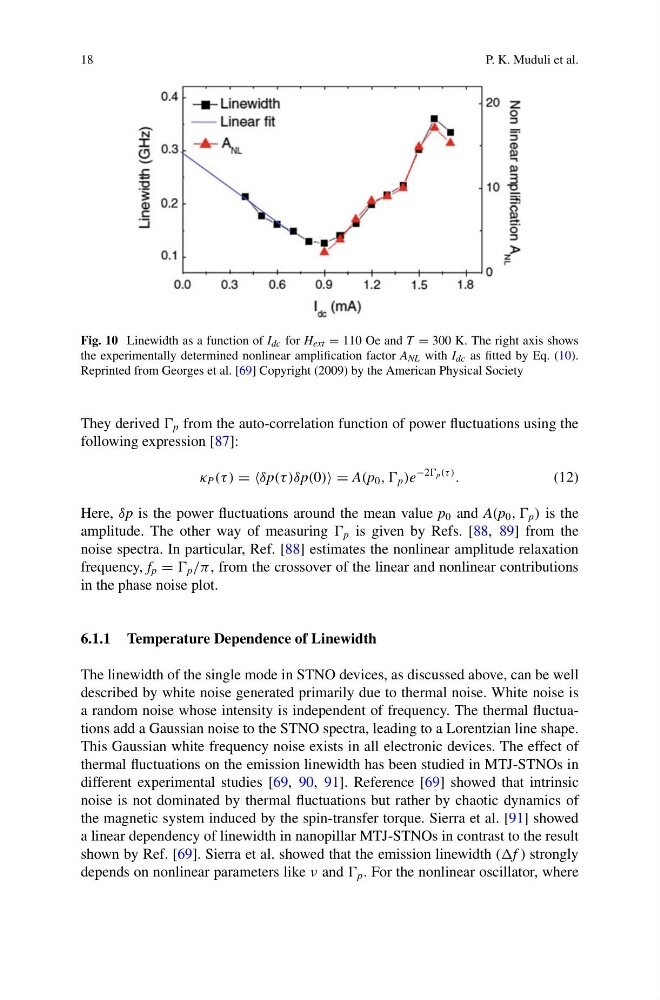
Fig. 10 Linewidth as a function of I dc for H ext = 110 Oe and T = 300 K. The right axis shows
the experimentally determined nonlinear amplification factor A NL with I dc as fitted by Eq. (10).
Reprinted from Georges et al. [69] Copyright (2009) by the American Physical Society
They derived p from the auto-correlation function of power fluctuations using the
following expression [87]:
κ P (τ ) = =δp(τ )δp(0) = A(p 0 , , p )e
−2 p (τ )
.
(12)
Here, δp is the power fluctuations around the mean value p 0 and A(p 0 , , p ) is the
amplitude. The other way of measuring p is given by Refs. [88, 89] from the
noise spectra. In particular, Ref. [88] estimates the nonlinear amplitude relaxation
frequency, f p = p /π , from the crossover of the linear and nonlinear contributions
in the phase noise plot.
6.1.1 Temperature Dependence of Linewidth
The linewidth of the single mode in STNO devices, as discussed above, can be well
described by white noise generated primarily due to thermal noise. White noise is
a random noise whose intensity is independent of frequency. The thermal fluctuations add a Gaussian noise to the STNO spectra, leading to a Lorentzian line shape.
This Gaussian white frequency noise exists in all electronic devices. The effect of
thermal fluctuations on the emission linewidth has been studied in MTJ-STNOs in
different experimental studies [69, 90, 91]. Reference [69] showed that intrinsic
noise is not dominated by thermal fluctuations but rather by chaotic dynamics of
the magnetic system induced by the spin-transfer torque. Sierra et al. [91] showed
a linear dependency of linewidth in nanopillar MTJ-STNOs in contrast to the result
shown by Ref. [69]. Sierra et al. showed that the emission linewidth (f ) strongly
depends on nonlinear parameters like ν and p . For the nonlinear oscillator, where
P. K. Muduli et al.
Fig. 10 Linewidth as a function of I dc for H ext = 110 Oe and T = 300 K. The right axis shows
the experimentally determined nonlinear amplification factor A NL with I dc as fitted by Eq. (10).
Reprinted from Georges et al. [69] Copyright (2009) by the American Physical Society
They derived p from the auto-correlation function of power fluctuations using the
following expression [87]:
κ P (τ ) = =δp(τ )δp(0) = A(p 0 , , p )e
−2 p (τ )
.
(12)
Here, δp is the power fluctuations around the mean value p 0 and A(p 0 , , p ) is the
amplitude. The other way of measuring p is given by Refs. [88, 89] from the
noise spectra. In particular, Ref. [88] estimates the nonlinear amplitude relaxation
frequency, f p = p /π , from the crossover of the linear and nonlinear contributions
in the phase noise plot.
6.1.1 Temperature Dependence of Linewidth
The linewidth of the single mode in STNO devices, as discussed above, can be well
described by white noise generated primarily due to thermal noise. White noise is
a random noise whose intensity is independent of frequency. The thermal fluctuations add a Gaussian noise to the STNO spectra, leading to a Lorentzian line shape.
This Gaussian white frequency noise exists in all electronic devices. The effect of
thermal fluctuations on the emission linewidth has been studied in MTJ-STNOs in
different experimental studies [69, 90, 91]. Reference [69] showed that intrinsic
noise is not dominated by thermal fluctuations but rather by chaotic dynamics of
the magnetic system induced by the spin-transfer torque. Sierra et al. [91] showed
a linear dependency of linewidth in nanopillar MTJ-STNOs in contrast to the result
shown by Ref. [69]. Sierra et al. showed that the emission linewidth (f ) strongly
depends on nonlinear parameters like ν and p . For the nonlinear oscillator, where