

184
K. Lee et al.
2.1 Experiments for Measuring SOTs
2.1.1 Spin-Torque Ferromagnetic Resonance Measurement
One of the most widely used methods to quantify the SOTs in various systems is
to use the spin torque-ferromagnetic resonance (ST-FMR) technique. Conventionally, this method was used to measure the spin Hall angle in various systems. The
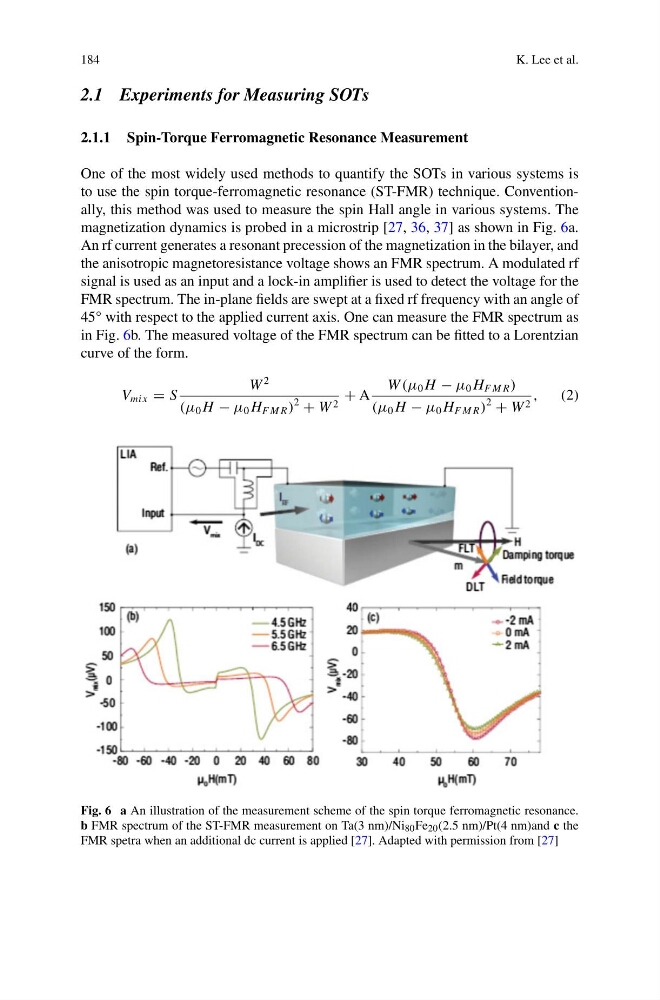
magnetization dynamics is probed in a microstrip [27, 36, 37] as shown in Fig. 6a.
An rf current generates a resonant precession of the magnetization in the bilayer, and
the anisotropic magnetoresistance voltage shows an FMR spectrum. A modulated rf
signal is used as an input and a lock-in amplifier is used to detect the voltage for the
FMR spectrum. The in-plane fields are swept at a fixed rf frequency with an angle of
45° with respect to the applied current axis. One can measure the FMR spectrum as
in Fig. 6b. The measured voltage of the FMR spectrum can be fitted to a Lorentzian
curve of the form.
V mi x = S
W
2
(μ 0 H − μ 0 H F M R )
2
+ W 2
+ A
W (μ 0 H − μ 0 H F M R )
(μ 0 H − μ 0 H F M R )
2
+ W 2
,
(2)
Fig. 6 a An illustration of the measurement scheme of the spin torque ferromagnetic resonance.
b FMR spectrum of the ST-FMR measurement on Ta(3 nm)/Ni 80 Fe 20 (2.5 nm)/Pt(4 nm)and c the
FMR spetra when an additional dc current is applied [27]. Adapted with permission from [27]
K. Lee et al.
2.1 Experiments for Measuring SOTs
2.1.1 Spin-Torque Ferromagnetic Resonance Measurement
One of the most widely used methods to quantify the SOTs in various systems is
to use the spin torque-ferromagnetic resonance (ST-FMR) technique. Conventionally, this method was used to measure the spin Hall angle in various systems. The
magnetization dynamics is probed in a microstrip [27, 36, 37] as shown in Fig. 6a.
An rf current generates a resonant precession of the magnetization in the bilayer, and
the anisotropic magnetoresistance voltage shows an FMR spectrum. A modulated rf
signal is used as an input and a lock-in amplifier is used to detect the voltage for the
FMR spectrum. The in-plane fields are swept at a fixed rf frequency with an angle of
45° with respect to the applied current axis. One can measure the FMR spectrum as
in Fig. 6b. The measured voltage of the FMR spectrum can be fitted to a Lorentzian
curve of the form.
V mi x = S
W
2
(μ 0 H − μ 0 H F M R )
2
+ W 2
+ A
W (μ 0 H − μ 0 H F M R )
(μ 0 H − μ 0 H F M R )
2
+ W 2
,
(2)
Fig. 6 a An illustration of the measurement scheme of the spin torque ferromagnetic resonance.
b FMR spectrum of the ST-FMR measurement on Ta(3 nm)/Ni 80 Fe 20 (2.5 nm)/Pt(4 nm)and c the
FMR spetra when an additional dc current is applied [27]. Adapted with permission from [27]