

33
influencing the freshwater budget of the Arctic Ocean and
adjacent seas.
River Runoff and Atmospheric Fluxes
The major source of liquid fresh water in the Arctic Ocean is
the continental runoff. The rivers discharge approximately
3300 km
3
year
−1
fresh water to the upper Arctic Ocean,
which accounts for 11% of the total global river discharge
(Fichot et al. 2013). Considering that the upper Arctic Ocean
only makes up 0.1% of Earth’s total ocean volume, this is a
remarkable contribution. Net precipitation (precipitation
minus evaporation) over the Arctic is estimated to
2200 km
3
year
−1
(Haine et al. 2015).
Syntheses of Arctic river discharge data revealed an
increase of 7–10% in the last 30 to 60 years correlated with
the NAO and global mean surface air temperature (Peterson
et al. 2002; Overeem and Syvitski 2010). Niederdrenk et al.
(2016) showed in a model study that a strong Icelandic low
promoting warmer and wetter conditions over Eurasia leads
to increased precipitation and thus enhanced river runoff to
the Arctic Ocean. This mechanism is proposed to be responsible for the most of the Arctic river runoff variability.
Although Déry and Wood (2005) found a 10% decrease in
annual river discharge from Canadian rivers into the Arctic
Ocean and North Atlantic, the total river discharge into the
Arctic Ocean increased by 5.6 km
3
year
−2
during the second
half of the twentieth century (McClelland et al. 2006). There
is evidence for an intensification of the global water cycle
related to global warming (Huntington 2006) explaining the
positive trends in precipitation and continental runoff.
Arctic Glacier and Greenland Ice Sheet Melt
Due to the warming atmosphere and ocean, freshwater fluxes
from both, the Greenland Ice Sheet and Arctic glaciers,
increased significantly in the last few decades (Yang et al.
2016). The Greenland Ice Sheet mass-loss more than doubled from 2002 to 2009 (Velicogna 2009). Yang et al. (2016)
estimated the acceleration of the trend to 20 Gt year
−2
.
Freshwater flux anomalies from surface meltwater and solid
ice discharge from 1995 to 2010 sum up to about 3000 km
3
(Bamber et al. 2012). Thereby, the highest freshwater flux
with an increase of about 50% was released into the Irminger
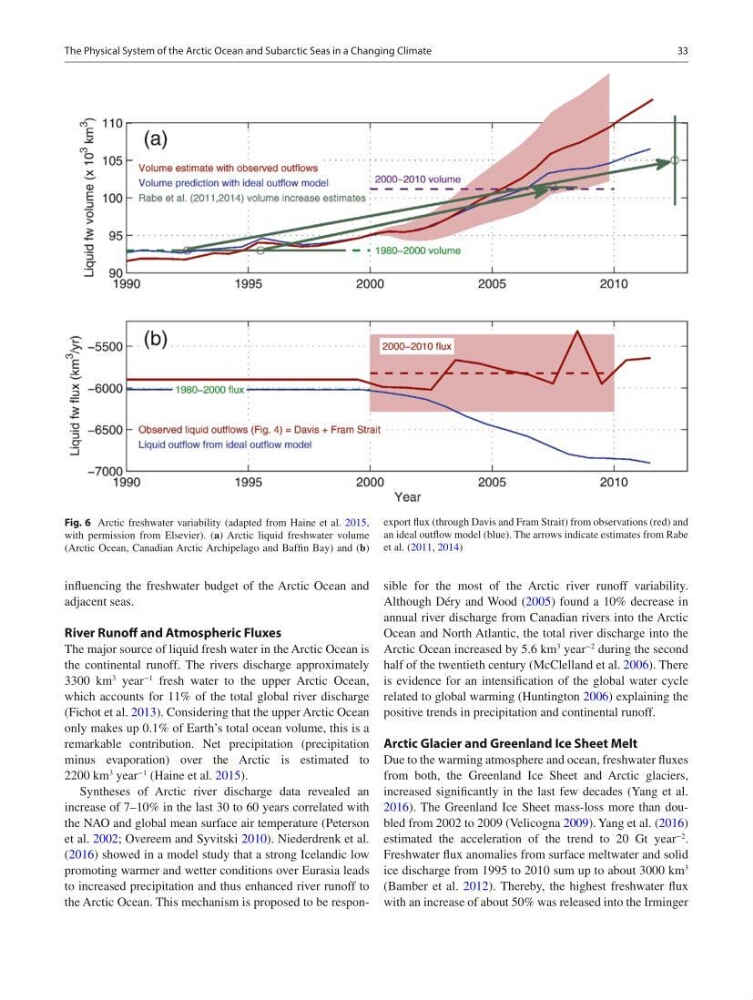
Fig. 6 Arctic freshwater variability (adapted from Haine et al. 2015,
with permission from Elsevier). (a) Arctic liquid freshwater volume
(Arctic Ocean, Canadian Arctic Archipelago and Baffin Bay) and (b)
export flux (through Davis and Fram Strait) from observations (red) and
an ideal outflow model (blue). The arrows indicate estimates from Rabe
et al. (2011, 2014)
The Physical System of the Arctic Ocean and Subarctic Seas in a Changing Climate
influencing the freshwater budget of the Arctic Ocean and
adjacent seas.
River Runoff and Atmospheric Fluxes
The major source of liquid fresh water in the Arctic Ocean is
the continental runoff. The rivers discharge approximately
3300 km
3
year
−1
fresh water to the upper Arctic Ocean,
which accounts for 11% of the total global river discharge
(Fichot et al. 2013). Considering that the upper Arctic Ocean
only makes up 0.1% of Earth’s total ocean volume, this is a
remarkable contribution. Net precipitation (precipitation
minus evaporation) over the Arctic is estimated to
2200 km
3
year
−1
(Haine et al. 2015).
Syntheses of Arctic river discharge data revealed an
increase of 7–10% in the last 30 to 60 years correlated with
the NAO and global mean surface air temperature (Peterson
et al. 2002; Overeem and Syvitski 2010). Niederdrenk et al.
(2016) showed in a model study that a strong Icelandic low
promoting warmer and wetter conditions over Eurasia leads
to increased precipitation and thus enhanced river runoff to
the Arctic Ocean. This mechanism is proposed to be responsible for the most of the Arctic river runoff variability.
Although Déry and Wood (2005) found a 10% decrease in
annual river discharge from Canadian rivers into the Arctic
Ocean and North Atlantic, the total river discharge into the
Arctic Ocean increased by 5.6 km
3
year
−2
during the second
half of the twentieth century (McClelland et al. 2006). There
is evidence for an intensification of the global water cycle
related to global warming (Huntington 2006) explaining the
positive trends in precipitation and continental runoff.
Arctic Glacier and Greenland Ice Sheet Melt
Due to the warming atmosphere and ocean, freshwater fluxes
from both, the Greenland Ice Sheet and Arctic glaciers,
increased significantly in the last few decades (Yang et al.
2016). The Greenland Ice Sheet mass-loss more than doubled from 2002 to 2009 (Velicogna 2009). Yang et al. (2016)
estimated the acceleration of the trend to 20 Gt year
−2
.
Freshwater flux anomalies from surface meltwater and solid
ice discharge from 1995 to 2010 sum up to about 3000 km
3
(Bamber et al. 2012). Thereby, the highest freshwater flux
with an increase of about 50% was released into the Irminger
Fig. 6 Arctic freshwater variability (adapted from Haine et al. 2015,
with permission from Elsevier). (a) Arctic liquid freshwater volume
(Arctic Ocean, Canadian Arctic Archipelago and Baffin Bay) and (b)
export flux (through Davis and Fram Strait) from observations (red) and
an ideal outflow model (blue). The arrows indicate estimates from Rabe
et al. (2011, 2014)
The Physical System of the Arctic Ocean and Subarctic Seas in a Changing Climate