

8
via equatorial Kelvin waves. Communicating information
from the southern to the northern hemisphere and vice versa
is hence a non-trivial enterprise in the ocean.
While the basic set-up of the marine tropical climate system is identical in all three tropical oceans, details differ
between basins. The Pacific Ocean has the largest extent and
is characterized by a relatively simple land-ocean geometry;
it behaves much like a perfect theoretical ocean. The tropical
Atlantic, in contrast, is much narrower and the surrounding
continents interact with the ocean in complex ways. For
example, the tropical Atlantic appears to be more susceptible
to extra-equatorial influences (e.g., Foltz and McPhaden
2010; Richter et al. 2013; Lübbecke et al. 2014; Nnamchi
et al. 2016), and variability is due to a number of interacting
mechanisms on overlapping time scales (Sutton et al. 2000;
Xie and Carton 2004). Therefore, the tropical Atlantic is less
readily understood than the tropical Pacific, and still poses
substantial challenges to the scientific community.
The mean state of the tropical Atlantic is characterized by
a complex interplay of atmospheric and oceanic features.
These are i) the trade wind systems of both the northern and
southern hemispheres, ii) a system of alternating shallow
zonal
2
currents in the ocean, and iii) a zonal gradient in
upper-ocean heat content that is also reflected in a pronounced zonal gradient in sea surface temperatures (SSTs),
with warm temperatures in the west and cooler surface
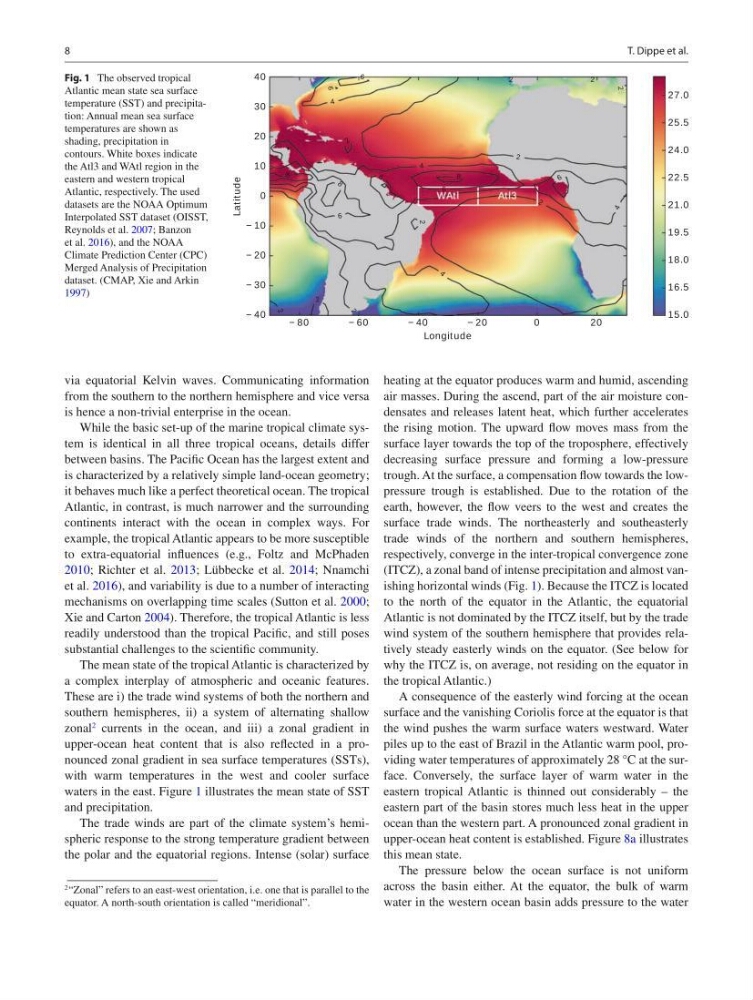
waters in the east. Figure 1 illustrates the mean state of SST
and precipitation.
The trade winds are part of the climate system’s hemispheric response to the strong temperature gradient between
the polar and the equatorial regions. Intense (solar) surface
2 “Zonal” refers to an east-west orientation, i.e. one that is parallel to the
equator. A north-south orientation is called “meridional”.
heating at the equator produces warm and humid, ascending
air masses. During the ascend, part of the air moisture condensates and releases latent heat, which further accelerates
the rising motion. The upward flow moves mass from the
surface layer towards the top of the troposphere, effectively
decreasing surface pressure and forming a low-pressure
trough. At the surface, a compensation flow towards the lowpressure trough is established. Due to the rotation of the
earth, however, the flow veers to the west and creates the
surface trade winds. The northeasterly and southeasterly
trade winds of the northern and southern hemispheres,
respectively, converge in the inter-tropical convergence zone
(ITCZ), a zonal band of intense precipitation and almost vanishing horizontal winds (Fig. 1). Because the ITCZ is located
to the north of the equator in the Atlantic, the equatorial
Atlantic is not dominated by the ITCZ itself, but by the trade
wind system of the southern hemisphere that provides relatively steady easterly winds on the equator. (See below for
why the ITCZ is, on average, not residing on the equator in
the tropical Atlantic.)
A consequence of the easterly wind forcing at the ocean
surface and the vanishing Coriolis force at the equator is that
the wind pushes the warm surface waters westward. Water
piles up to the east of Brazil in the Atlantic warm pool, providing water temperatures of approximately 28 °C at the surface. Conversely, the surface layer of warm water in the
eastern tropical Atlantic is thinned out considerably – the
eastern part of the basin stores much less heat in the upper
ocean than the western part. A pronounced zonal gradient in
upper-ocean heat content is established. Figure 8a illustrates
this mean state.
The pressure below the ocean surface is not uniform
across the basin either. At the equator, the bulk of warm
water in the western ocean basin adds pressure to the water
Fig. 1 The observed tropical
Atlantic mean state sea surface
temperature (SST) and precipitation: Annual mean sea surface
temperatures are shown as
shading, precipitation in
contours. White boxes indicate
the Atl3 and WAtl region in the
eastern and western tropical
Atlantic, respectively. The used
datasets are the NOAA Optimum
Interpolated SST dataset (OISST,
Reynolds et al. 2007; Banzon
et al. 2016), and the NOAA
Climate Prediction Center (CPC)
Merged Analysis of Precipitation
dataset. (CMAP, Xie and Arkin
1997)
T. Dippe et al.
via equatorial Kelvin waves. Communicating information
from the southern to the northern hemisphere and vice versa
is hence a non-trivial enterprise in the ocean.
While the basic set-up of the marine tropical climate system is identical in all three tropical oceans, details differ
between basins. The Pacific Ocean has the largest extent and
is characterized by a relatively simple land-ocean geometry;
it behaves much like a perfect theoretical ocean. The tropical
Atlantic, in contrast, is much narrower and the surrounding
continents interact with the ocean in complex ways. For
example, the tropical Atlantic appears to be more susceptible
to extra-equatorial influences (e.g., Foltz and McPhaden
2010; Richter et al. 2013; Lübbecke et al. 2014; Nnamchi
et al. 2016), and variability is due to a number of interacting
mechanisms on overlapping time scales (Sutton et al. 2000;
Xie and Carton 2004). Therefore, the tropical Atlantic is less
readily understood than the tropical Pacific, and still poses
substantial challenges to the scientific community.
The mean state of the tropical Atlantic is characterized by
a complex interplay of atmospheric and oceanic features.
These are i) the trade wind systems of both the northern and
southern hemispheres, ii) a system of alternating shallow
zonal
2
currents in the ocean, and iii) a zonal gradient in
upper-ocean heat content that is also reflected in a pronounced zonal gradient in sea surface temperatures (SSTs),
with warm temperatures in the west and cooler surface
waters in the east. Figure 1 illustrates the mean state of SST
and precipitation.
The trade winds are part of the climate system’s hemispheric response to the strong temperature gradient between
the polar and the equatorial regions. Intense (solar) surface
2 “Zonal” refers to an east-west orientation, i.e. one that is parallel to the
equator. A north-south orientation is called “meridional”.
heating at the equator produces warm and humid, ascending
air masses. During the ascend, part of the air moisture condensates and releases latent heat, which further accelerates
the rising motion. The upward flow moves mass from the
surface layer towards the top of the troposphere, effectively
decreasing surface pressure and forming a low-pressure
trough. At the surface, a compensation flow towards the lowpressure trough is established. Due to the rotation of the
earth, however, the flow veers to the west and creates the
surface trade winds. The northeasterly and southeasterly
trade winds of the northern and southern hemispheres,
respectively, converge in the inter-tropical convergence zone
(ITCZ), a zonal band of intense precipitation and almost vanishing horizontal winds (Fig. 1). Because the ITCZ is located
to the north of the equator in the Atlantic, the equatorial
Atlantic is not dominated by the ITCZ itself, but by the trade
wind system of the southern hemisphere that provides relatively steady easterly winds on the equator. (See below for
why the ITCZ is, on average, not residing on the equator in
the tropical Atlantic.)
A consequence of the easterly wind forcing at the ocean
surface and the vanishing Coriolis force at the equator is that
the wind pushes the warm surface waters westward. Water
piles up to the east of Brazil in the Atlantic warm pool, providing water temperatures of approximately 28 °C at the surface. Conversely, the surface layer of warm water in the
eastern tropical Atlantic is thinned out considerably – the
eastern part of the basin stores much less heat in the upper
ocean than the western part. A pronounced zonal gradient in
upper-ocean heat content is established. Figure 8a illustrates
this mean state.
The pressure below the ocean surface is not uniform
across the basin either. At the equator, the bulk of warm
water in the western ocean basin adds pressure to the water
Fig. 1 The observed tropical
Atlantic mean state sea surface
temperature (SST) and precipitation: Annual mean sea surface
temperatures are shown as
shading, precipitation in
contours. White boxes indicate
the Atl3 and WAtl region in the
eastern and western tropical
Atlantic, respectively. The used
datasets are the NOAA Optimum
Interpolated SST dataset (OISST,
Reynolds et al. 2007; Banzon
et al. 2016), and the NOAA
Climate Prediction Center (CPC)
Merged Analysis of Precipitation
dataset. (CMAP, Xie and Arkin
1997)
T. Dippe et al.