

184
Sample Preparation
The environmental samples taken for MP analysis usually
contain a high amount of biogenic material (biota and detritus) and inorganic material (clay, silicates). Therefore,
extraction of MPs from the environmental matrix is crucial
to facilitate the subsequent identification of MPs. Sometimes,
sieving is used to remove larger particles (> 5 mm) from the
samples as well as to divide them into distinct size fractions
that might be further analyzed differently (Löder and Gerdts
2015). Especially for bulk sediment samples, MPs have to be
extracted from the inorganic sediment matrix first while for
water and biota samples the removal of the biogenic matrix
is put first.
Extraction Techniques
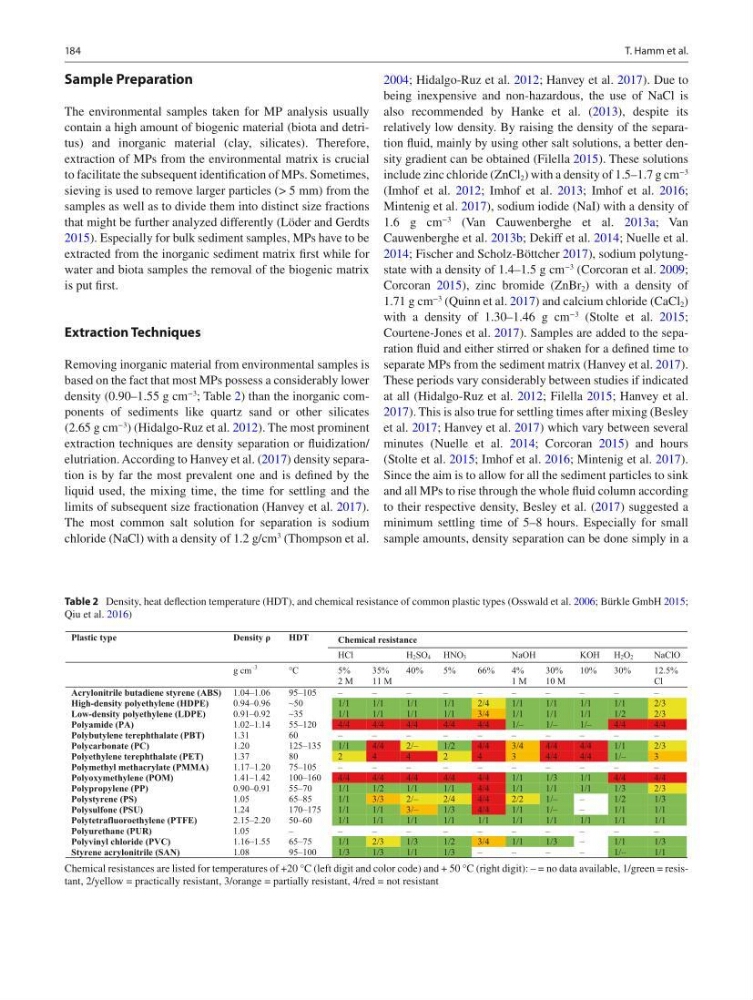
Removing inorganic material from environmental samples is
based on the fact that most MPs possess a considerably lower
density (0.90–1.55 g cm
−3
; Table 2) than the inorganic components of sediments like quartz sand or other silicates
(2.65 g cm
−3
) (Hidalgo-Ruz et al. 2012). The most prominent
extraction techniques are density separation or fluidization/
elutriation. According to Hanvey et al. (2017) density separation is by far the most prevalent one and is defined by the
liquid used, the mixing time, the time for settling and the
limits of subsequent size fractionation (Hanvey et al. 2017).
The most common salt solution for separation is sodium
chloride (NaCl) with a density of 1.2 g/cm
3
(Thompson et al.
2004; Hidalgo-Ruz et al. 2012; Hanvey et al. 2017). Due to
being inexpensive and non-hazardous, the use of NaCl is
also recommended by Hanke et al. (2013), despite its
relatively low density. By raising the density of the separation fluid, mainly by using other salt solutions, a better density gradient can be obtained (Filella 2015). These solutions
include zinc chloride (ZnCl 2 ) with a density of 1.5–1.7 g cm
−3
(Imhof et al. 2012; Imhof et al. 2013; Imhof et al. 2016;
Mintenig et al. 2017), sodium iodide (NaI) with a density of
1.6 g cm
−3
(Van Cauwenberghe et al. 2013a; Van
Cauwenberghe et al. 2013b; Dekiff et al. 2014; Nuelle et al.
2014; Fischer and Scholz-Böttcher 2017), sodium polytungstate with a density of 1.4–1.5 g cm
−3
(Corcoran et al. 2009;
Corcoran 2015), zinc bromide (ZnBr 2 ) with a density of
1.71 g cm
−3
(Quinn et al. 2017) and calcium chloride (CaCl 2 )
with a density of 1.30–1.46 g cm
−3
(Stolte et al. 2015;
Courtene-Jones et al. 2017). Samples are added to the separation fluid and either stirred or shaken for a defined time to
separate MPs from the sediment matrix (Hanvey et al. 2017).
These periods vary considerably between studies if indicated
at all (Hidalgo-Ruz et al. 2012; Filella 2015; Hanvey et al.
2017). This is also true for settling times after mixing (Besley
et al. 2017; Hanvey et al. 2017) which vary between several
minutes (Nuelle et al. 2014; Corcoran 2015) and hours
(Stolte et al. 2015; Imhof et al. 2016; Mintenig et al. 2017).
Since the aim is to allow for all the sediment particles to sink
and all MPs to rise through the whole fluid column according
to their respective density, Besley et al. (2017) suggested a
minimum settling time of 5–8 hours. Especially for small
sample amounts, density separation can be done simply in a
Plastic type
D ensity ρ
HDT
Chemical resistance
HCl
H 2SO4 HNO3
NaOH
KOH
H2O2
NaClO
g cm
–3
°C
5%
2 M
35%
11 M
40%
5%
66%
4%
1 M
30%
10 M
10%
30%
12.5%
Cl
Acrylonitrile butadiene styrene (ABS) 1.04–1.06
95–105
–
–
–
–
–
–
–
–
–
–
High-density polyethylene (HDPE)
0.94–0.96
~50
1/1
1/1
1/1
1/1
2/4
1/1
1/1
1/1
1/1
2/3
Low-density polyethylene (LDPE)
0.91–0.92
~35
1/1
1/1
1/1
1/1
3/4
1/1
1/1
1/1
1/2
2/3
Polyamide (PA)
1.02–1.14
55–120
4/4
4/4
4/4
4/4
4/4
1/–
1/–
1/–
4/4
4/4
Polybutylene terephthalate (PBT)
1.31
60
–
–
–
–
–
–
–
–
–
–
Polycarbonate (PC)
1.20
125–135
1/1
4/4
2/–
1/2
4/4
3/4
4/4
4/4
1/1
2/3
Polyethylene terephthalate (PET)
1.37
80
2
4
4
2
4
3
4/4
4/4
1/–
3
Polymethyl methacrylate (PMMA)
1.17–1.20
75–105
–
–
–
–
–
–
–
–
–
–
Polyoxymethylene (POM)
1.41–1.42
100–160
4/4
4/4
4/4
4/4
4/4
1/1
1/3
1/1
4/4
4/4
Polypropylene (PP)
0.90–0.91
55–70
1/1
1/2
1/1
1/1
4/4
1/1
1/1
1/1
1/3
2/3
Polystyrene (PS)
1.05
65–85
1/1
3/3
2/–
2/4
4/4
2/2
1/–
–
1/2
1/3
Polysulfone (PSU)
1.24
170–175
1/1
1/1
3/–
1/3
4/4
1/1
1/–
–
1/1
1/1
Polytetrafluoroethylene (PTFE)
2.15–2.20
50–60
1/1
1/1
1/1
1/1
1/1
1/1
1/1
1/1
1/1
1/1
Polyurethane (PUR)
1.05
–
–
–
–
–
–
–
–
–
–
–
Polyvinyl chloride (PVC)
1.16–1.55
65–75
1/1
2/3
1/3
1/2
3/4
1/1
1/3
–
1/1
1/3
Styrene acrylonitrile (SAN)
1.08
95–100
1/3
1/3
1/1
1/3
–
–
–
–
1/–
1/1
Table 2 Density, heat deflection temperature (HDT), and chemical resistance of common plastic types (Osswald et al. 2006; Bürkle GmbH 2015;
Qiu et al. 2016)
Chemical resistances are listed for temperatures of +20 °C (left digit and color code) and + 50 °C (right digit): – = no data available, 1/green = resistant, 2/yellow = practically resistant, 3/orange = partially resistant, 4/red = not resistant
T. Hamm et al.
Sample Preparation
The environmental samples taken for MP analysis usually
contain a high amount of biogenic material (biota and detritus) and inorganic material (clay, silicates). Therefore,
extraction of MPs from the environmental matrix is crucial
to facilitate the subsequent identification of MPs. Sometimes,
sieving is used to remove larger particles (> 5 mm) from the
samples as well as to divide them into distinct size fractions
that might be further analyzed differently (Löder and Gerdts
2015). Especially for bulk sediment samples, MPs have to be
extracted from the inorganic sediment matrix first while for
water and biota samples the removal of the biogenic matrix
is put first.
Extraction Techniques
Removing inorganic material from environmental samples is
based on the fact that most MPs possess a considerably lower
density (0.90–1.55 g cm
−3
; Table 2) than the inorganic components of sediments like quartz sand or other silicates
(2.65 g cm
−3
) (Hidalgo-Ruz et al. 2012). The most prominent
extraction techniques are density separation or fluidization/
elutriation. According to Hanvey et al. (2017) density separation is by far the most prevalent one and is defined by the
liquid used, the mixing time, the time for settling and the
limits of subsequent size fractionation (Hanvey et al. 2017).
The most common salt solution for separation is sodium
chloride (NaCl) with a density of 1.2 g/cm
3
(Thompson et al.
2004; Hidalgo-Ruz et al. 2012; Hanvey et al. 2017). Due to
being inexpensive and non-hazardous, the use of NaCl is
also recommended by Hanke et al. (2013), despite its
relatively low density. By raising the density of the separation fluid, mainly by using other salt solutions, a better density gradient can be obtained (Filella 2015). These solutions
include zinc chloride (ZnCl 2 ) with a density of 1.5–1.7 g cm
−3
(Imhof et al. 2012; Imhof et al. 2013; Imhof et al. 2016;
Mintenig et al. 2017), sodium iodide (NaI) with a density of
1.6 g cm
−3
(Van Cauwenberghe et al. 2013a; Van
Cauwenberghe et al. 2013b; Dekiff et al. 2014; Nuelle et al.
2014; Fischer and Scholz-Böttcher 2017), sodium polytungstate with a density of 1.4–1.5 g cm
−3
(Corcoran et al. 2009;
Corcoran 2015), zinc bromide (ZnBr 2 ) with a density of
1.71 g cm
−3
(Quinn et al. 2017) and calcium chloride (CaCl 2 )
with a density of 1.30–1.46 g cm
−3
(Stolte et al. 2015;
Courtene-Jones et al. 2017). Samples are added to the separation fluid and either stirred or shaken for a defined time to
separate MPs from the sediment matrix (Hanvey et al. 2017).
These periods vary considerably between studies if indicated
at all (Hidalgo-Ruz et al. 2012; Filella 2015; Hanvey et al.
2017). This is also true for settling times after mixing (Besley
et al. 2017; Hanvey et al. 2017) which vary between several
minutes (Nuelle et al. 2014; Corcoran 2015) and hours
(Stolte et al. 2015; Imhof et al. 2016; Mintenig et al. 2017).
Since the aim is to allow for all the sediment particles to sink
and all MPs to rise through the whole fluid column according
to their respective density, Besley et al. (2017) suggested a
minimum settling time of 5–8 hours. Especially for small
sample amounts, density separation can be done simply in a
Plastic type
D ensity ρ
HDT
Chemical resistance
HCl
H 2SO4 HNO3
NaOH
KOH
H2O2
NaClO
g cm
–3
°C
5%
2 M
35%
11 M
40%
5%
66%
4%
1 M
30%
10 M
10%
30%
12.5%
Cl
Acrylonitrile butadiene styrene (ABS) 1.04–1.06
95–105
–
–
–
–
–
–
–
–
–
–
High-density polyethylene (HDPE)
0.94–0.96
~50
1/1
1/1
1/1
1/1
2/4
1/1
1/1
1/1
1/1
2/3
Low-density polyethylene (LDPE)
0.91–0.92
~35
1/1
1/1
1/1
1/1
3/4
1/1
1/1
1/1
1/2
2/3
Polyamide (PA)
1.02–1.14
55–120
4/4
4/4
4/4
4/4
4/4
1/–
1/–
1/–
4/4
4/4
Polybutylene terephthalate (PBT)
1.31
60
–
–
–
–
–
–
–
–
–
–
Polycarbonate (PC)
1.20
125–135
1/1
4/4
2/–
1/2
4/4
3/4
4/4
4/4
1/1
2/3
Polyethylene terephthalate (PET)
1.37
80
2
4
4
2
4
3
4/4
4/4
1/–
3
Polymethyl methacrylate (PMMA)
1.17–1.20
75–105
–
–
–
–
–
–
–
–
–
–
Polyoxymethylene (POM)
1.41–1.42
100–160
4/4
4/4
4/4
4/4
4/4
1/1
1/3
1/1
4/4
4/4
Polypropylene (PP)
0.90–0.91
55–70
1/1
1/2
1/1
1/1
4/4
1/1
1/1
1/1
1/3
2/3
Polystyrene (PS)
1.05
65–85
1/1
3/3
2/–
2/4
4/4
2/2
1/–
–
1/2
1/3
Polysulfone (PSU)
1.24
170–175
1/1
1/1
3/–
1/3
4/4
1/1
1/–
–
1/1
1/1
Polytetrafluoroethylene (PTFE)
2.15–2.20
50–60
1/1
1/1
1/1
1/1
1/1
1/1
1/1
1/1
1/1
1/1
Polyurethane (PUR)
1.05
–
–
–
–
–
–
–
–
–
–
–
Polyvinyl chloride (PVC)
1.16–1.55
65–75
1/1
2/3
1/3
1/2
3/4
1/1
1/3
–
1/1
1/3
Styrene acrylonitrile (SAN)
1.08
95–100
1/3
1/3
1/1
1/3
–
–
–
–
1/–
1/1
Table 2 Density, heat deflection temperature (HDT), and chemical resistance of common plastic types (Osswald et al. 2006; Bürkle GmbH 2015;
Qiu et al. 2016)
Chemical resistances are listed for temperatures of +20 °C (left digit and color code) and + 50 °C (right digit): – = no data available, 1/green = resistant, 2/yellow = practically resistant, 3/orange = partially resistant, 4/red = not resistant
T. Hamm et al.