

154
Appendix B
employing different techniques have shown (5) that channel proteins experience
important conformational changes in response to binding or proximity of ions, and
also [5], computer simulations of internal motions of proteins can be carried out for
time periods of the order of a few hundred picoseconds. Our calculation is a first
step in the quantification of the process, showing the possibility of its existence.
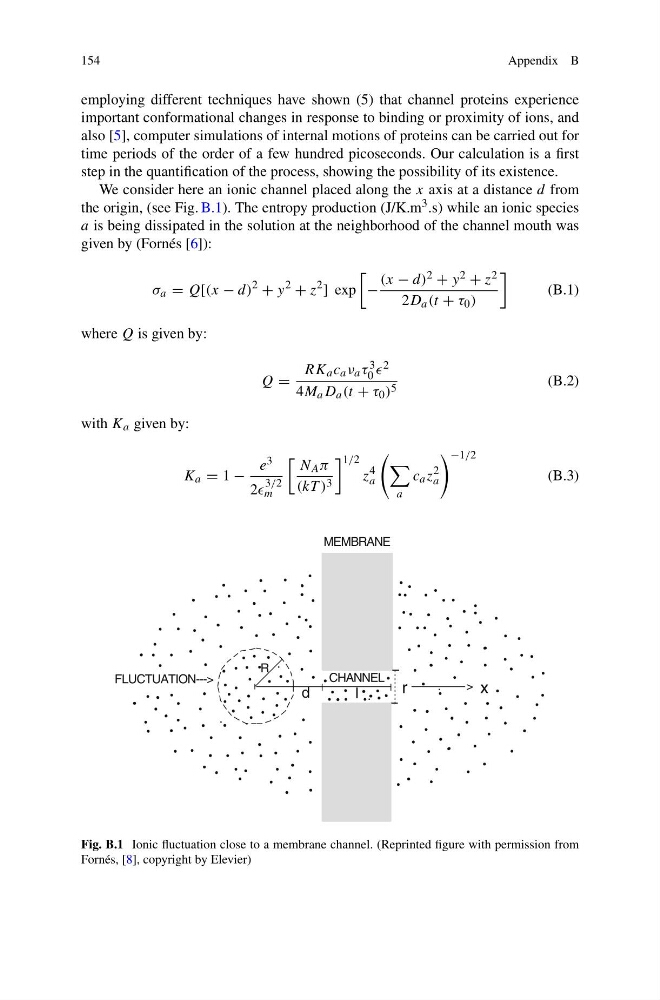
We consider here an ionic channel placed along the x axis at a distance d from
the origin, (see Fig. B.1). The entropy production (J/K.m 3 .s) while an ionic species
a is being dissipated in the solution at the neighborhood of the channel mouth was
given by (Fornés [6]):
σ a = Q[(x − d)
2
+ y
2
+ z
2
] exp
−
(x − d) 2 + y 2 + z 2
2D a (t + τ 0 )
(B.1)
where Q is given by:
Q =
RK a c a ν a τ 3
0 2
4M a D a (t + τ 0 ) 5
(B.2)
with K a given by:
K a = 1 −
e 3
2
3/2
m
N A π
(kT ) 3
1/2
z
4
a
a
c a z
2
a
−1/2
(B.3)
r
CHANNEL
MEMBRANE
FLUCTUATION--->
R
. .
.
.
.
.
.
.
.
.
.
.
.
.
.
.
. .
.
.
.
.
.
.
.
.
.
.
.
.
.
.
.
.
.
.
.
.
.
.
.
.
.
.
.
.
.
.
.
.
.
.
.
.
.
.
.
.
.
.
.
.
.
.
.
.
.
.
.
.
.
. .
.
.
.
.
.
.
.
.
.
.
.
.
.
.
.
.
.
.
.
.
.
.
.
.
.
.
.
.
.
.
.
.
.
.
.
. .
.
.
.
.
.
.
.
.
.
.
.
.
.
. .
.
.
.
.
.
.
.
.
.
.
.
.
.
.
.
.
.
.
.
.
.
. .
.
.
.
. .
.
.
.
. .
.
. .
.
.
.
.
.
.
.
.
.
.
.
.
x
d
.
. .
.
.
.
.
.
>
Fig. B.1 Ionic fluctuation close to a membrane channel. (Reprinted figure with permission from
Fornés, [8], copyright by Elevier)
Appendix B
employing different techniques have shown (5) that channel proteins experience
important conformational changes in response to binding or proximity of ions, and
also [5], computer simulations of internal motions of proteins can be carried out for
time periods of the order of a few hundred picoseconds. Our calculation is a first
step in the quantification of the process, showing the possibility of its existence.
We consider here an ionic channel placed along the x axis at a distance d from
the origin, (see Fig. B.1). The entropy production (J/K.m 3 .s) while an ionic species
a is being dissipated in the solution at the neighborhood of the channel mouth was
given by (Fornés [6]):
σ a = Q[(x − d)
2
+ y
2
+ z
2
] exp
−
(x − d) 2 + y 2 + z 2
2D a (t + τ 0 )
(B.1)
where Q is given by:
Q =
RK a c a ν a τ 3
0 2
4M a D a (t + τ 0 ) 5
(B.2)
with K a given by:
K a = 1 −
e 3
2
3/2
m
N A π
(kT ) 3
1/2
z
4
a
a
c a z
2
a
−1/2
(B.3)
r
CHANNEL
MEMBRANE
FLUCTUATION--->
R
. .
.
.
.
.
.
.
.
.
.
.
.
.
.
.
. .
.
.
.
.
.
.
.
.
.
.
.
.
.
.
.
.
.
.
.
.
.
.
.
.
.
.
.
.
.
.
.
.
.
.
.
.
.
.
.
.
.
.
.
.
.
.
.
.
.
.
.
.
.
. .
.
.
.
.
.
.
.
.
.
.
.
.
.
.
.
.
.
.
.
.
.
.
.
.
.
.
.
.
.
.
.
.
.
.
.
. .
.
.
.
.
.
.
.
.
.
.
.
.
.
. .
.
.
.
.
.
.
.
.
.
.
.
.
.
.
.
.
.
.
.
.
.
. .
.
.
.
. .
.
.
.
. .
.
. .
.
.
.
.
.
.
.
.
.
.
.
.
x
d
.
. .
.
.
.
.
.
>
Fig. B.1 Ionic fluctuation close to a membrane channel. (Reprinted figure with permission from
Fornés, [8], copyright by Elevier)