

5.3 Vector-Like Quarks
167
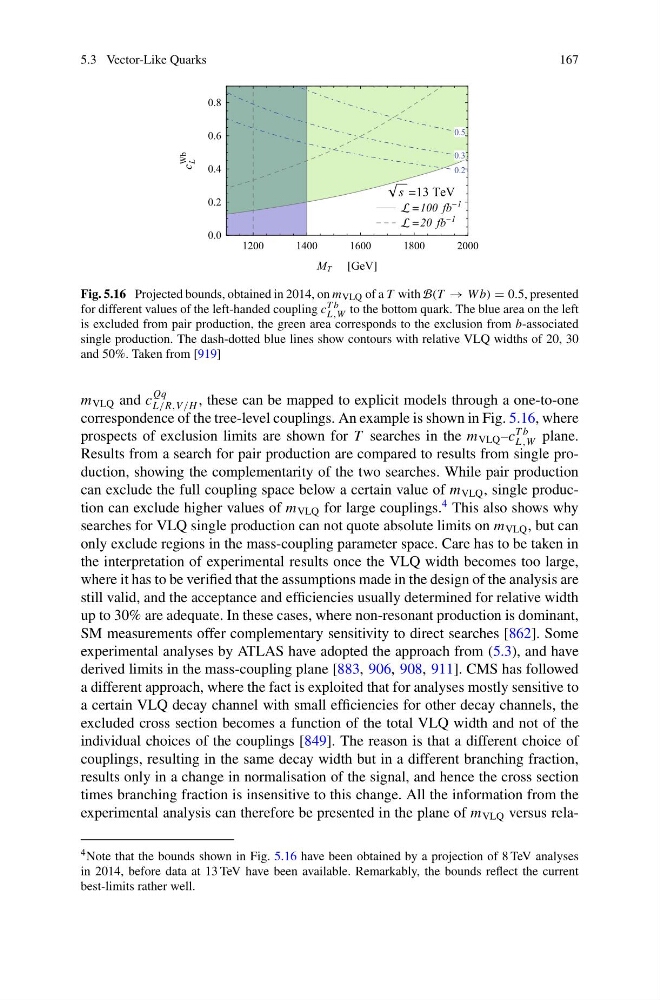
Fig. 5.16 Projected bounds, obtained in 2014, on m VLQ of a T with B(T → W b) = 0.5, presented
for different values of the left-handed coupling c T b
L ,W to the bottom quark. The blue area on the left
is excluded from pair production, the green area corresponds to the exclusion from b-associated
single production. The dash-dotted blue lines show contours with relative VLQ widths of 20, 30
and 50%. Taken from [919]
m VLQ and c
Qq
L/R,V /H , these can be mapped to explicit models through a one-to-one
correspondence of the tree-level couplings. An example is shown in Fig. 5.16, where
prospects of exclusion limits are shown for T searches in the m VLQ –c
T b
L ,W plane.
Results from a search for pair production are compared to results from single production, showing the complementarity of the two searches. While pair production
can exclude the full coupling space below a certain value of m VLQ , single production can exclude higher values of m VLQ for large couplings.
4 This also shows why
searches for VLQ single production can not quote absolute limits on m VLQ , but can
only exclude regions in the mass-coupling parameter space. Care has to be taken in
the interpretation of experimental results once the VLQ width becomes too large,
where it has to be verified that the assumptions made in the design of the analysis are
still valid, and the acceptance and efficiencies usually determined for relative width
up to 30% are adequate. In these cases, where non-resonant production is dominant,
SM measurements offer complementary sensitivity to direct searches [862]. Some
experimental analyses by ATLAS have adopted the approach from (5.3), and have
derived limits in the mass-coupling plane [883, 906, 908, 911]. CMS has followed
a different approach, where the fact is exploited that for analyses mostly sensitive to
a certain VLQ decay channel with small efficiencies for other decay channels, the
excluded cross section becomes a function of the total VLQ width and not of the
individual choices of the couplings [849]. The reason is that a different choice of
couplings, resulting in the same decay width but in a different branching fraction,
results only in a change in normalisation of the signal, and hence the cross section
times branching fraction is insensitive to this change. All the information from the
experimental analysis can therefore be presented in the plane of m VLQ versus rela4 Note that the bounds shown in Fig. 5.16 have been obtained by a projection of 8 TeV analyses
in 2014, before data at 13 TeV have been available. Remarkably, the bounds reflect the current
best-limits rather well.
167
Fig. 5.16 Projected bounds, obtained in 2014, on m VLQ of a T with B(T → W b) = 0.5, presented
for different values of the left-handed coupling c T b
L ,W to the bottom quark. The blue area on the left
is excluded from pair production, the green area corresponds to the exclusion from b-associated
single production. The dash-dotted blue lines show contours with relative VLQ widths of 20, 30
and 50%. Taken from [919]
m VLQ and c
L/R,V /H , these can be mapped to explicit models through a one-to-one
correspondence of the tree-level couplings. An example is shown in Fig. 5.16, where
prospects of exclusion limits are shown for T searches in the m VLQ –c
T b
L ,W plane.
Results from a search for pair production are compared to results from single production, showing the complementarity of the two searches. While pair production
can exclude the full coupling space below a certain value of m VLQ , single production can exclude higher values of m VLQ for large couplings.
4 This also shows why
searches for VLQ single production can not quote absolute limits on m VLQ , but can
only exclude regions in the mass-coupling parameter space. Care has to be taken in
the interpretation of experimental results once the VLQ width becomes too large,
where it has to be verified that the assumptions made in the design of the analysis are
still valid, and the acceptance and efficiencies usually determined for relative width
up to 30% are adequate. In these cases, where non-resonant production is dominant,
SM measurements offer complementary sensitivity to direct searches [862]. Some
experimental analyses by ATLAS have adopted the approach from (5.3), and have
derived limits in the mass-coupling plane [883, 906, 908, 911]. CMS has followed
a different approach, where the fact is exploited that for analyses mostly sensitive to
a certain VLQ decay channel with small efficiencies for other decay channels, the
excluded cross section becomes a function of the total VLQ width and not of the
individual choices of the couplings [849]. The reason is that a different choice of
couplings, resulting in the same decay width but in a different branching fraction,
results only in a change in normalisation of the signal, and hence the cross section
times branching fraction is insensitive to this change. All the information from the
experimental analysis can therefore be presented in the plane of m VLQ versus rela4 Note that the bounds shown in Fig. 5.16 have been obtained by a projection of 8 TeV analyses
in 2014, before data at 13 TeV have been available. Remarkably, the bounds reflect the current
best-limits rather well.