

5.2 Resonances Coupling to Third Generation Quarks
143
A very recent analysis by ATLAS in the all-hadronic channel uses the full 13 TeV
dataset with 139 fb
−1 [811]. The identification of t jets is performed with a deep
neural network [525], which uses high-level discriminants of anti-k T R = 1.0 jets
as input, such as jet p T and mass, τ i , splitting scales and energy correlation functions.
A working point of the algorithm is used, corresponding to an efficiency of of 80%
over the full range of top quark p T considered. The misidentification probability for
light quark and gluon jets is approximately 3% at p T = 500 GeV, increasing to 8% at
p T = 3 TeV. The analysis is performed in two categories, defined by the number of
b-tagged ghost-associated track-jets. The high efficiency of the t tagging algorithm,
together with the high statistical power of the data, allows for the first time in a tt
resonance search to estimate the background from a fit to data with a parametrised
function of the form
f (x) = p 1 (1 − x)
p 2 x
p 3 + p 4 log(x)
.
(5.2)
This power-law function has one more free parameter than the functional form
used in V V searches, (5.1). The additional flexibility is needed because of the different shapes of the multijet and tt background distributions. The form of (5.2) has been
established in control regions, where data and simulated events have been mixed in
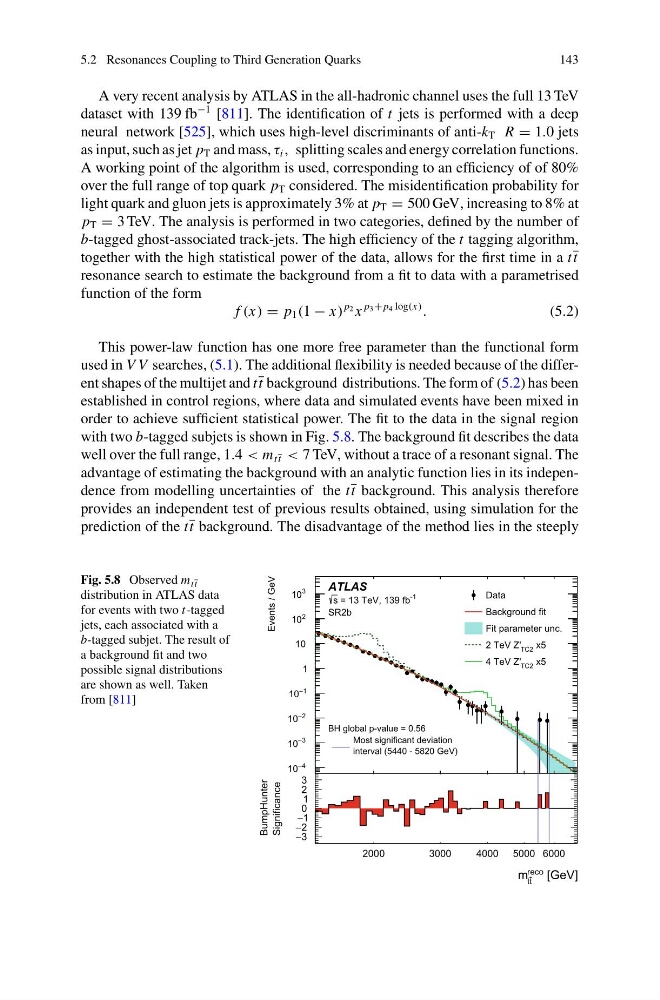
order to achieve sufficient statistical power. The fit to the data in the signal region
with two b-tagged subjets is shown in Fig. 5.8. The background fit describes the data
well over the full range, 1.4 < m tt < 7 TeV, without a trace of a resonant signal. The
advantage of estimating the background with an analytic function lies in its independence from modelling uncertainties of the tt background. This analysis therefore
provides an independent test of previous results obtained, using simulation for the
prediction of the tt background. The disadvantage of the method lies in the steeply
Fig. 5.8 Observed m tt
distribution in ATLAS data
for events with two t-tagged
jets, each associated with a
b-tagged subjet. The result of
a background fit and two
possible signal distributions
are shown as well. Taken
from [811]
2000
3000
4000 5000 6000
[GeV]
reco
t
t
m
3
−
2
−
1
−
0
1
2
3
Significance
BumpHunter
4
−
10
3
−
10
2
−
10
1
−
10
1
10
2
10
3
10
Events / GeV
Data
Background fit
Fit parameter unc.
x5
TC2
2 TeV Z'
x5
TC2
4 TeV Z'
interval (5440 - 5820 GeV)
Most significant deviation
ATLAS
-1
= 13 TeV, 139 fb
s
SR2b
BH global p-value = 0.56
143
A very recent analysis by ATLAS in the all-hadronic channel uses the full 13 TeV
dataset with 139 fb
−1 [811]. The identification of t jets is performed with a deep
neural network [525], which uses high-level discriminants of anti-k T R = 1.0 jets
as input, such as jet p T and mass, τ i , splitting scales and energy correlation functions.
A working point of the algorithm is used, corresponding to an efficiency of of 80%
over the full range of top quark p T considered. The misidentification probability for
light quark and gluon jets is approximately 3% at p T = 500 GeV, increasing to 8% at
p T = 3 TeV. The analysis is performed in two categories, defined by the number of
b-tagged ghost-associated track-jets. The high efficiency of the t tagging algorithm,
together with the high statistical power of the data, allows for the first time in a tt
resonance search to estimate the background from a fit to data with a parametrised
function of the form
f (x) = p 1 (1 − x)
p 2 x
p 3 + p 4 log(x)
.
(5.2)
This power-law function has one more free parameter than the functional form
used in V V searches, (5.1). The additional flexibility is needed because of the different shapes of the multijet and tt background distributions. The form of (5.2) has been
established in control regions, where data and simulated events have been mixed in
order to achieve sufficient statistical power. The fit to the data in the signal region
with two b-tagged subjets is shown in Fig. 5.8. The background fit describes the data
well over the full range, 1.4 < m tt < 7 TeV, without a trace of a resonant signal. The
advantage of estimating the background with an analytic function lies in its independence from modelling uncertainties of the tt background. This analysis therefore
provides an independent test of previous results obtained, using simulation for the
prediction of the tt background. The disadvantage of the method lies in the steeply
Fig. 5.8 Observed m tt
distribution in ATLAS data
for events with two t-tagged
jets, each associated with a
b-tagged subjet. The result of
a background fit and two
possible signal distributions
are shown as well. Taken
from [811]
2000
3000
4000 5000 6000
[GeV]
reco
t
t
m
3
−
2
−
1
−
0
1
2
3
Significance
BumpHunter
4
−
10
3
−
10
2
−
10
1
−
10
1
10
2
10
3
10
Events / GeV
Data
Background fit
Fit parameter unc.
x5
TC2
2 TeV Z'
x5
TC2
4 TeV Z'
interval (5440 - 5820 GeV)
Most significant deviation
ATLAS
-1
= 13 TeV, 139 fb
s
SR2b
BH global p-value = 0.56