

142
5 Direct Searches for New Physics
Events / 100 GeV
1
10
2
10
Events / 100 GeV
1
10
2
10
Data
t
t
non-top multijet
Z’ 2.0 TeV, 1% width
y| < 1.0; 2 b tag (high-mass)
Δ
|
(8 TeV)
-1
19.7 fb
CMS
[GeV]
t
t
M
0
1000
2000
3000
Data / Bkg
0.5
1
1.5
Events / 100 GeV
1
10
2
10
3
10
Events / 100 GeV
1
10
2
10
3
10
Data
t
t
non-top multijet
Z’ 2.0 TeV, 1% width
y| < 1.0; 1 b tag (high-mass)
Δ
|
(8 TeV)
-1
19.7 fb
CMS
[GeV]
t
t
M
0
1000
2000
3000
Data / Bkg
0.5
1
1.5
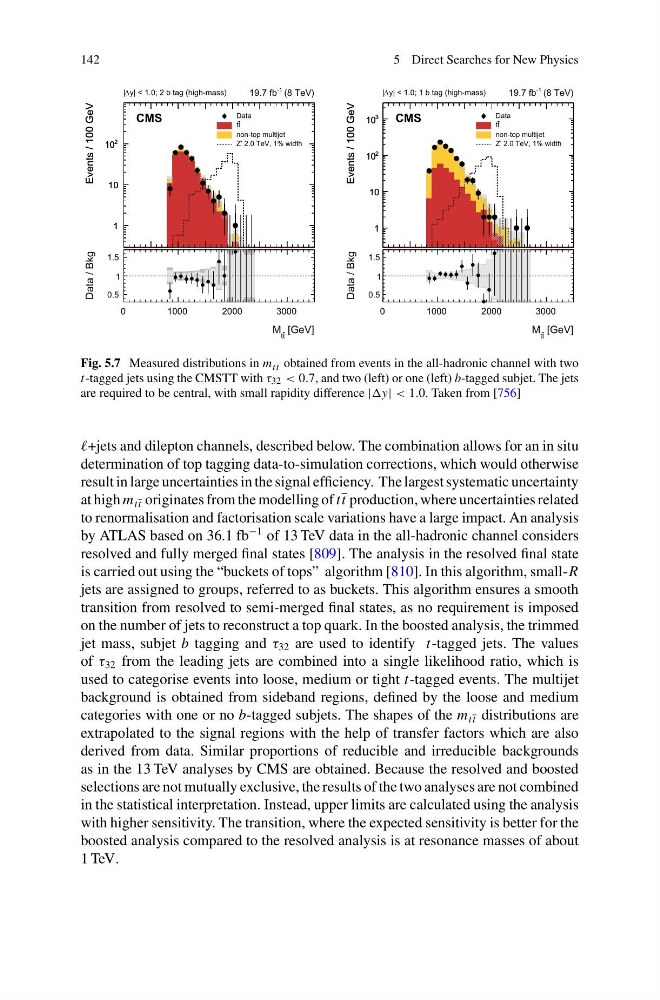
Fig. 5.7 Measured distributions in m tt obtained from events in the all-hadronic channel with two
t-tagged jets using the CMSTT with τ 32 < 0.7, and two (left) or one (left) b-tagged subjet. The jets
are required to be central, with small rapidity difference | < 1.0. Taken from [756]
+jets and dilepton channels, described below. The combination allows for an in situ
determination of top tagging data-to-simulation corrections, which would otherwise
result in large uncertainties in the signal efficiency. The largest systematic uncertainty
at high m tt originates from the modelling of tt production, where uncertainties related
to renormalisation and factorisation scale variations have a large impact. An analysis
by ATLAS based on 36.1 fb
−1 of 13 TeV data in the all-hadronic channel considers
resolved and fully merged final states [809]. The analysis in the resolved final state
is carried out using the “buckets of tops” algorithm [810]. In this algorithm, small-R
jets are assigned to groups, referred to as buckets. This algorithm ensures a smooth
transition from resolved to semi-merged final states, as no requirement is imposed
on the number of jets to reconstruct a top quark. In the boosted analysis, the trimmed
jet mass, subjet b tagging and τ 32 are used to identify t-tagged jets. The values
of τ 32 from the leading jets are combined into a single likelihood ratio, which is
used to categorise events into loose, medium or tight t-tagged events. The multijet
background is obtained from sideband regions, defined by the loose and medium
categories with one or no b-tagged subjets. The shapes of the m tt distributions are
extrapolated to the signal regions with the help of transfer factors which are also
derived from data. Similar proportions of reducible and irreducible backgrounds
as in the 13 TeV analyses by CMS are obtained. Because the resolved and boosted
selections are not mutually exclusive, the results of the two analyses are not combined
in the statistical interpretation. Instead, upper limits are calculated using the analysis
with higher sensitivity. The transition, where the expected sensitivity is better for the
boosted analysis compared to the resolved analysis is at resonance masses of about
1 TeV.
5 Direct Searches for New Physics
Events / 100 GeV
1
10
2
10
Events / 100 GeV
1
10
2
10
Data
t
t
non-top multijet
Z’ 2.0 TeV, 1% width
y| < 1.0; 2 b tag (high-mass)
Δ
|
(8 TeV)
-1
19.7 fb
CMS
[GeV]
t
t
M
0
1000
2000
3000
Data / Bkg
0.5
1
1.5
Events / 100 GeV
1
10
2
10
3
10
Events / 100 GeV
1
10
2
10
3
10
Data
t
t
non-top multijet
Z’ 2.0 TeV, 1% width
y| < 1.0; 1 b tag (high-mass)
Δ
|
(8 TeV)
-1
19.7 fb
CMS
[GeV]
t
t
M
0
1000
2000
3000
Data / Bkg
0.5
1
1.5
Fig. 5.7 Measured distributions in m tt obtained from events in the all-hadronic channel with two
t-tagged jets using the CMSTT with τ 32 < 0.7, and two (left) or one (left) b-tagged subjet. The jets
are required to be central, with small rapidity difference | < 1.0. Taken from [756]
+jets and dilepton channels, described below. The combination allows for an in situ
determination of top tagging data-to-simulation corrections, which would otherwise
result in large uncertainties in the signal efficiency. The largest systematic uncertainty
at high m tt originates from the modelling of tt production, where uncertainties related
to renormalisation and factorisation scale variations have a large impact. An analysis
by ATLAS based on 36.1 fb
−1 of 13 TeV data in the all-hadronic channel considers
resolved and fully merged final states [809]. The analysis in the resolved final state
is carried out using the “buckets of tops” algorithm [810]. In this algorithm, small-R
jets are assigned to groups, referred to as buckets. This algorithm ensures a smooth
transition from resolved to semi-merged final states, as no requirement is imposed
on the number of jets to reconstruct a top quark. In the boosted analysis, the trimmed
jet mass, subjet b tagging and τ 32 are used to identify t-tagged jets. The values
of τ 32 from the leading jets are combined into a single likelihood ratio, which is
used to categorise events into loose, medium or tight t-tagged events. The multijet
background is obtained from sideband regions, defined by the loose and medium
categories with one or no b-tagged subjets. The shapes of the m tt distributions are
extrapolated to the signal regions with the help of transfer factors which are also
derived from data. Similar proportions of reducible and irreducible backgrounds
as in the 13 TeV analyses by CMS are obtained. Because the resolved and boosted
selections are not mutually exclusive, the results of the two analyses are not combined
in the statistical interpretation. Instead, upper limits are calculated using the analysis
with higher sensitivity. The transition, where the expected sensitivity is better for the
boosted analysis compared to the resolved analysis is at resonance masses of about
1 TeV.