

112
4 Standard Model Measurements
0
200
400
600
800
1000
1200
1400
1600
3
10
×
Events / 7 GeV
W
Z
t
t
Multijet
Total background
=3.7
H
μ
),
b
H(b
Data
(13 TeV)
-1
137 fb
CMS Preliminary
< 1200 GeV
T
450 < p
Deep double-b tagger
Failing region
60
80
100 120 140 160 180 200
(GeV)
SD
m
1
−
0
1
2
3
Data
σ
Bkg
−
Data
0
5000
10000
15000
20000
25000
Events / 7 GeV
W
Z
t
t
Multijet
Total background
=3.7
H
μ
),
b
H(b
Data
(13 TeV)
-1
137 fb
CMS Preliminary
< 1200 GeV
T
450 < p
Deep double-b tagger
Passing region
60
80
100 120 140 160 180 200
(GeV)
SD
m
4
−
2
−
0
2
4
6
Data
σ
Bkg
−
Data
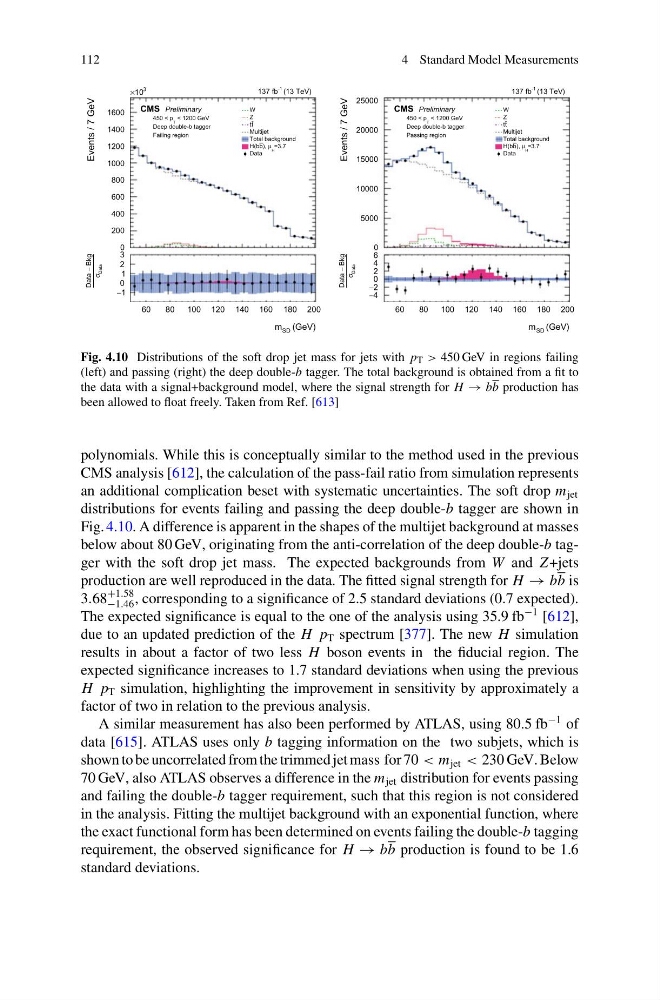
Fig. 4.10 Distributions of the soft drop jet mass for jets with p T > 450 GeV in regions failing
(left) and passing (right) the deep double-b tagger. The total background is obtained from a fit to
the data with a signal+background model, where the signal strength for H → bb production has
been allowed to float freely. Taken from Ref. [613]
polynomials. While this is conceptually similar to the method used in the previous
CMS analysis [612], the calculation of the pass-fail ratio from simulation represents
an additional complication beset with systematic uncertainties. The soft drop m jet
distributions for events failing and passing the deep double-b tagger are shown in
Fig. 4.10. A difference is apparent in the shapes of the multijet background at masses
below about 80 GeV, originating from the anti-correlation of the deep double-b tagger with the soft drop jet mass. The expected backgrounds from W and Z +jets
production are well reproduced in the data. The fitted signal strength for H → bb is
3.68
+1.58
−1.46 , corresponding to a significance of 2.5 standard deviations (0.7 expected).
The expected significance is equal to the one of the analysis using 35.9 fb
−1 [612],
due to an updated prediction of the H p T spectrum [377]. The new H simulation
results in about a factor of two less H boson events in the fiducial region. The
expected significance increases to 1.7 standard deviations when using the previous
H p T simulation, highlighting the improvement in sensitivity by approximately a
factor of two in relation to the previous analysis.
A similar measurement has also been performed by ATLAS, using 80.5 fb
−1 of
data [615]. ATLAS uses only b tagging information on the two subjets, which is
shown to be uncorrelated from the trimmed jet mass for 70 < m jet < 230 GeV. Below
70 GeV, also ATLAS observes a difference in the m jet distribution for events passing
and failing the double-b tagger requirement, such that this region is not considered
in the analysis. Fitting the multijet background with an exponential function, where
the exact functional form has been determined on events failing the double-b tagging
requirement, the observed significance for H → bb production is found to be 1.6
standard deviations.
4 Standard Model Measurements
0
200
400
600
800
1000
1200
1400
1600
3
10
×
Events / 7 GeV
W
Z
t
t
Multijet
Total background
=3.7
H
μ
),
b
H(b
Data
(13 TeV)
-1
137 fb
CMS Preliminary
< 1200 GeV
T
450 < p
Deep double-b tagger
Failing region
60
80
100 120 140 160 180 200
(GeV)
SD
m
1
−
0
1
2
3
Data
σ
Bkg
−
Data
0
5000
10000
15000
20000
25000
Events / 7 GeV
W
Z
t
t
Multijet
Total background
=3.7
H
μ
),
b
H(b
Data
(13 TeV)
-1
137 fb
CMS Preliminary
< 1200 GeV
T
450 < p
Deep double-b tagger
Passing region
60
80
100 120 140 160 180 200
(GeV)
SD
m
4
−
2
−
0
2
4
6
Data
σ
Bkg
−
Data
Fig. 4.10 Distributions of the soft drop jet mass for jets with p T > 450 GeV in regions failing
(left) and passing (right) the deep double-b tagger. The total background is obtained from a fit to
the data with a signal+background model, where the signal strength for H → bb production has
been allowed to float freely. Taken from Ref. [613]
polynomials. While this is conceptually similar to the method used in the previous
CMS analysis [612], the calculation of the pass-fail ratio from simulation represents
an additional complication beset with systematic uncertainties. The soft drop m jet
distributions for events failing and passing the deep double-b tagger are shown in
Fig. 4.10. A difference is apparent in the shapes of the multijet background at masses
below about 80 GeV, originating from the anti-correlation of the deep double-b tagger with the soft drop jet mass. The expected backgrounds from W and Z +jets
production are well reproduced in the data. The fitted signal strength for H → bb is
3.68
+1.58
−1.46 , corresponding to a significance of 2.5 standard deviations (0.7 expected).
The expected significance is equal to the one of the analysis using 35.9 fb
−1 [612],
due to an updated prediction of the H p T spectrum [377]. The new H simulation
results in about a factor of two less H boson events in the fiducial region. The
expected significance increases to 1.7 standard deviations when using the previous
H p T simulation, highlighting the improvement in sensitivity by approximately a
factor of two in relation to the previous analysis.
A similar measurement has also been performed by ATLAS, using 80.5 fb
−1 of
data [615]. ATLAS uses only b tagging information on the two subjets, which is
shown to be uncorrelated from the trimmed jet mass for 70 < m jet < 230 GeV. Below
70 GeV, also ATLAS observes a difference in the m jet distribution for events passing
and failing the double-b tagger requirement, such that this region is not considered
in the analysis. Fitting the multijet background with an exponential function, where
the exact functional form has been determined on events failing the double-b tagging
requirement, the observed significance for H → bb production is found to be 1.6
standard deviations.