

46
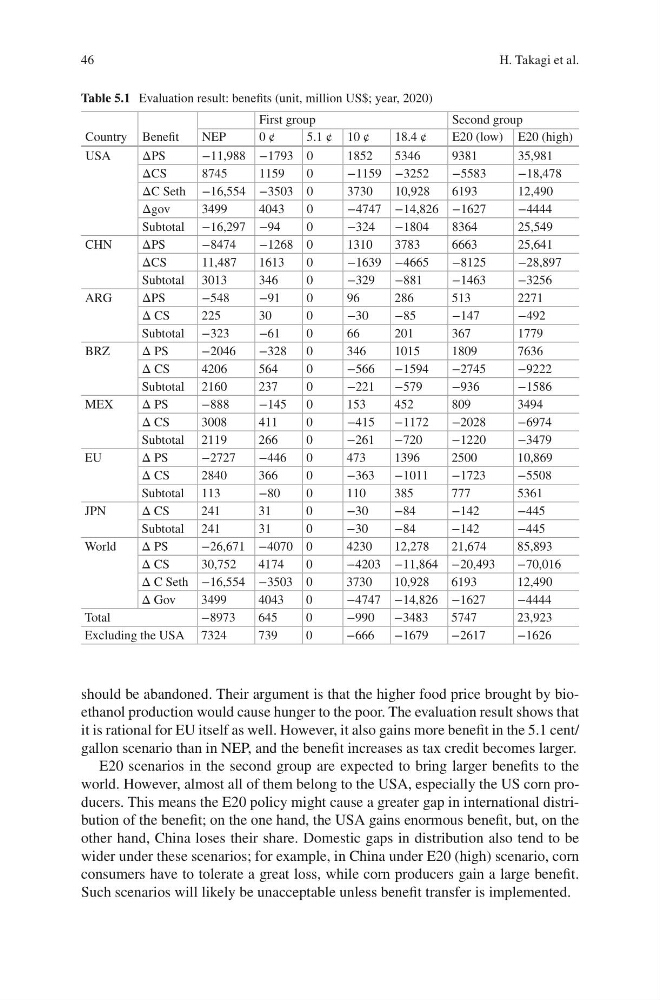
should be abandoned. Their argument is that the higher food price brought by bioethanol production would cause hunger to the poor. The evaluation result shows that
it is rational for EU itself as well. However, it also gains more benefit in the 5.1 cent/
gallon scenario than in NEP, and the benefit increases as tax credit becomes larger.
E20 scenarios in the second group are expected to bring larger benefits to the
world. However, almost all of them belong to the USA, especially the US corn producers. This means the E20 policy might cause a greater gap in international distribution of the benefit; on the one hand, the USA gains enormous benefit, but, on the
other hand, China loses their share. Domestic gaps in distribution also tend to be
wider under these scenarios; for example, in China under E20 (high) scenario, corn
consumers have to tolerate a great loss, while corn producers gain a large benefit.
Such scenarios will likely be unacceptable unless benefit transfer is implemented.
Table 5.1 Evaluation result: benefits (unit, million US$; year, 2020)
Country Benefit
First group
Second group
NEP
0 ¢
5.1 ¢ 10 ¢
18.4 ¢
E20 (low) E20 (high)
USA
ΔPS
−11,988 −1793 0
1852
5346
9381
35,981
ΔCS
8745
1159
0
−1159 −3252
−5583
−18,478
ΔC Seth −16,554 −3503 0
3730
10,928
6193
12,490
Δgov
3499
4043
0
−4747 −14,826 −1627
−4444
Subtotal −16,297 −94
0
−324
−1804
8364
25,549
CHN
ΔPS
−8474
−1268 0
1310
3783
6663
25,641
ΔCS
11,487
1613
0
−1639 −4665
−8125
−28,897
Subtotal 3013
346
0
−329
−881
−1463
−3256
ARG
ΔPS
−548
−91
0
96
286
513
2271
Δ CS
225
30
0
−30
−85
−147
−492
Subtotal −323
−61
0
66
201
367
1779
BRZ
Δ PS
−2046
−328
0
346
1015
1809
7636
Δ CS
4206
564
0
−566
−1594
−2745
−9222
Subtotal 2160
237
0
−221
−579
−936
−1586
MEX
Δ PS
−888
−145
0
153
452
809
3494
Δ CS
3008
411
0
−415
−1172
−2028
−6974
Subtotal 2119
266
0
−261
−720
−1220
−3479
EU
Δ PS
−2727
−446
0
473
1396
2500
10,869
Δ CS
2840
366
0
−363
−1011
−1723
−5508
Subtotal 113
−80
0
110
385
777
5361
JPN
Δ CS
241
31
0
−30
−84
−142
−445
Subtotal 241
31
0
−30
−84
−142
−445
World
Δ PS
−26,671 −4070 0
4230
12,278
21,674
85,893
Δ CS
30,752
4174
0
−4203 −11,864 −20,493
−70,016
Δ C Seth −16,554 −3503 0
3730
10,928
6193
12,490
Δ Gov
3499
4043
0
−4747 −14,826 −1627
−4444
Total
−8973
645
0
−990
−3483
5747
23,923
Excluding the USA 7324
739
0
−666
−1679
−2617
−1626
H. Takagi et al.
should be abandoned. Their argument is that the higher food price brought by bioethanol production would cause hunger to the poor. The evaluation result shows that
it is rational for EU itself as well. However, it also gains more benefit in the 5.1 cent/
gallon scenario than in NEP, and the benefit increases as tax credit becomes larger.
E20 scenarios in the second group are expected to bring larger benefits to the
world. However, almost all of them belong to the USA, especially the US corn producers. This means the E20 policy might cause a greater gap in international distribution of the benefit; on the one hand, the USA gains enormous benefit, but, on the
other hand, China loses their share. Domestic gaps in distribution also tend to be
wider under these scenarios; for example, in China under E20 (high) scenario, corn
consumers have to tolerate a great loss, while corn producers gain a large benefit.
Such scenarios will likely be unacceptable unless benefit transfer is implemented.
Table 5.1 Evaluation result: benefits (unit, million US$; year, 2020)
Country Benefit
First group
Second group
NEP
0 ¢
5.1 ¢ 10 ¢
18.4 ¢
E20 (low) E20 (high)
USA
ΔPS
−11,988 −1793 0
1852
5346
9381
35,981
ΔCS
8745
1159
0
−1159 −3252
−5583
−18,478
ΔC Seth −16,554 −3503 0
3730
10,928
6193
12,490
Δgov
3499
4043
0
−4747 −14,826 −1627
−4444
Subtotal −16,297 −94
0
−324
−1804
8364
25,549
CHN
ΔPS
−8474
−1268 0
1310
3783
6663
25,641
ΔCS
11,487
1613
0
−1639 −4665
−8125
−28,897
Subtotal 3013
346
0
−329
−881
−1463
−3256
ARG
ΔPS
−548
−91
0
96
286
513
2271
Δ CS
225
30
0
−30
−85
−147
−492
Subtotal −323
−61
0
66
201
367
1779
BRZ
Δ PS
−2046
−328
0
346
1015
1809
7636
Δ CS
4206
564
0
−566
−1594
−2745
−9222
Subtotal 2160
237
0
−221
−579
−936
−1586
MEX
Δ PS
−888
−145
0
153
452
809
3494
Δ CS
3008
411
0
−415
−1172
−2028
−6974
Subtotal 2119
266
0
−261
−720
−1220
−3479
EU
Δ PS
−2727
−446
0
473
1396
2500
10,869
Δ CS
2840
366
0
−363
−1011
−1723
−5508
Subtotal 113
−80
0
110
385
777
5361
JPN
Δ CS
241
31
0
−30
−84
−142
−445
Subtotal 241
31
0
−30
−84
−142
−445
World
Δ PS
−26,671 −4070 0
4230
12,278
21,674
85,893
Δ CS
30,752
4174
0
−4203 −11,864 −20,493
−70,016
Δ C Seth −16,554 −3503 0
3730
10,928
6193
12,490
Δ Gov
3499
4043
0
−4747 −14,826 −1627
−4444
Total
−8973
645
0
−990
−3483
5747
23,923
Excluding the USA 7324
739
0
−666
−1679
−2617
−1626
H. Takagi et al.