

258
three times greater than other cases, and converting waste cooking oil to BDF is the
best among all cases (Fig. 15.4b). Palm oil shows the smallest EF among three cases
of imported biodiesel from other countries.
15.3.2 Scenario Analysis
Considering the targets for 2015, 2025, and 2035, different cases to achieve the
targets (Figs. 15.1 and 15.2), the maximum supply capacity of each domestic biomass source (Table 15.3), and the domestic biofuel ratio (Table 15.4), we calculated
CF, WF, and EF from 2015 to 2023 (Figs. 15.5, 15.6, 15.7, and 15.8). In addition to
the five cases for each biofuel described in Figs. 15.1 and 15.2, we prepared a sixth
case that maximizes the domestic biomass sources by combining sorghum, construction waste wood, and rice straw for bioethanol and by combining rapeseed and
waste cooking oil for biodiesel (Table 15.4).
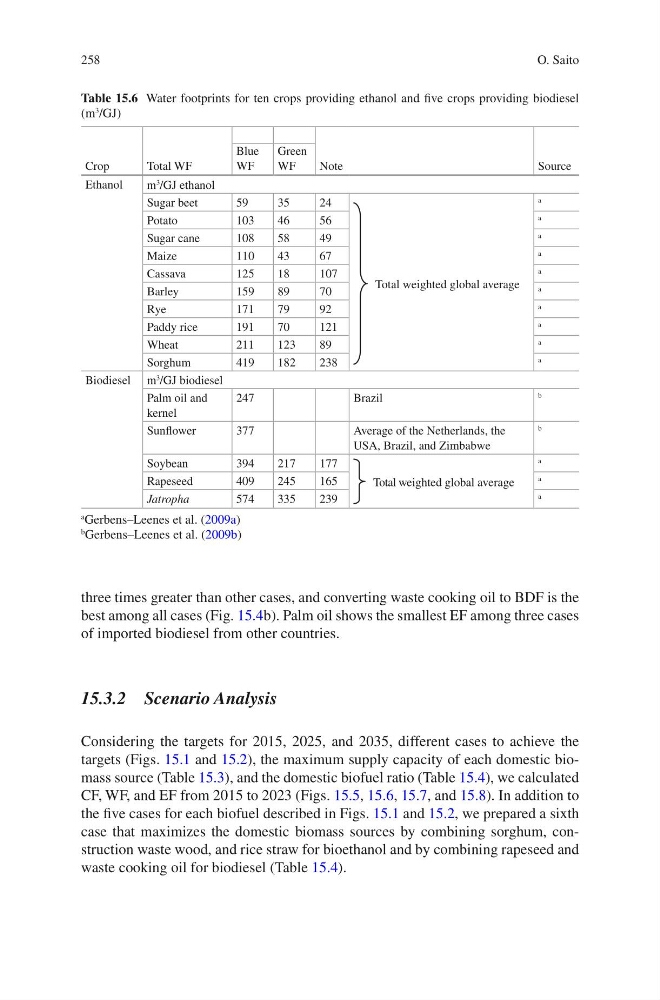
Table 15.6 Water footprints for ten crops providing ethanol and five crops providing biodiesel
(m
3
/GJ)
Crop
Total WF
Note
Source
Blue
WF
Green
WF
Ethanol
m
3
/GJ ethanol
Sugar beet
59
35
24
Total weighted global average
a
Potato
103
46
56
a
Sugar cane
108
58
49
a
Maize
110
43
67
a
Cassava
125
18
107
a
Barley
159
89
70
a
Rye
171
79
92
a
Paddy rice
191
70
121
a
Wheat
211
123
89
a
Sorghum
419
182
238
a
Biodiesel m
3
/GJ biodiesel
Palm oil and
kernel
247
Brazil
b
Sunflower
377
Average of the Netherlands, the
USA, Brazil, and Zimbabwe
b
Soybean
394
217
177
Total weighted global average
a
Rapeseed
409
245
165
a
Jatropha
574
335
239
a
a
Gerbens–Leenes et al. (2009a)
b
Gerbens–Leenes et al. (2009b)
O. Saito
three times greater than other cases, and converting waste cooking oil to BDF is the
best among all cases (Fig. 15.4b). Palm oil shows the smallest EF among three cases
of imported biodiesel from other countries.
15.3.2 Scenario Analysis
Considering the targets for 2015, 2025, and 2035, different cases to achieve the
targets (Figs. 15.1 and 15.2), the maximum supply capacity of each domestic biomass source (Table 15.3), and the domestic biofuel ratio (Table 15.4), we calculated
CF, WF, and EF from 2015 to 2023 (Figs. 15.5, 15.6, 15.7, and 15.8). In addition to
the five cases for each biofuel described in Figs. 15.1 and 15.2, we prepared a sixth
case that maximizes the domestic biomass sources by combining sorghum, construction waste wood, and rice straw for bioethanol and by combining rapeseed and
waste cooking oil for biodiesel (Table 15.4).
Table 15.6 Water footprints for ten crops providing ethanol and five crops providing biodiesel
(m
3
/GJ)
Crop
Total WF
Note
Source
Blue
WF
Green
WF
Ethanol
m
3
/GJ ethanol
Sugar beet
59
35
24
Total weighted global average
a
Potato
103
46
56
a
Sugar cane
108
58
49
a
Maize
110
43
67
a
Cassava
125
18
107
a
Barley
159
89
70
a
Rye
171
79
92
a
Paddy rice
191
70
121
a
Wheat
211
123
89
a
Sorghum
419
182
238
a
Biodiesel m
3
/GJ biodiesel
Palm oil and
kernel
247
Brazil
b
Sunflower
377
Average of the Netherlands, the
USA, Brazil, and Zimbabwe
b
Soybean
394
217
177
Total weighted global average
a
Rapeseed
409
245
165
a
Jatropha
574
335
239
a
a
Gerbens–Leenes et al. (2009a)
b
Gerbens–Leenes et al. (2009b)
O. Saito