

251
reviewed to identify differences among biomass sources. The maximum supply
capacities of domestic options such as rice straw ethanol and waste cooking oil were
calculated on the basis of domestic production and consumption of each biomass
source (Table 15.3). Due to the variation in CF and WF values within the same biomass source, we used both upper-end and lower-end values as best case and worst
case while calculating EF. Table 15.4 summarizes the domestic biofuel ratio (%) of
each case and the target year. Unless Japan cannot expand the maximum supply
capacity of the domestic options (Table 15.3), the domestic biofuel ratio will
decrease owing to the increase in imported biofuel, which is necessary to fill the gap
between domestic production and the targets, as described in Table 15.2.
4. Construction wasted
wood ethanol
Sugar
Cellulose
(woody)
Cellulose
(herbaceous)
Options
(Biomass source)
Feedstock
Land use and competition
Producer
countries
1. Maize
2. Sugarcane
3. Sweet sorghum
4. Construction waste
wood
5. Rice straw
Starch
Changes in land usage
Competition with food production
Changes in land usage
Cultivation on an abandoned
farmland
No change in land usage
Competition with direct combustion
No change in land usage
Competition with feedstuff and
compost materials
USA
Domestic
production
Brazil
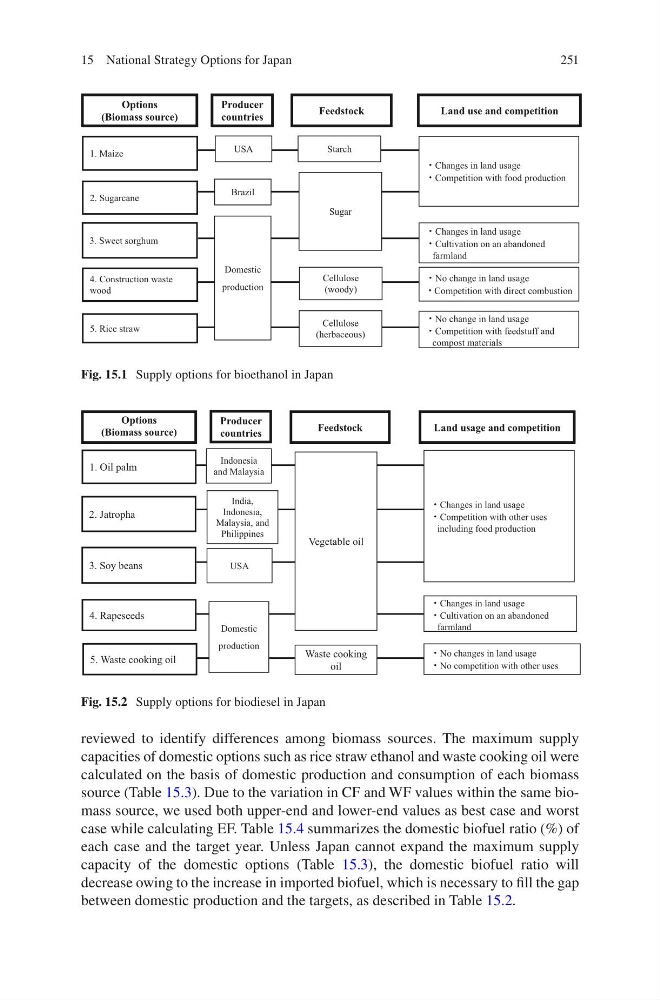
Fig. 15.1 Supply options for bioethanol in Japan
1. Oil palm
2. Jatropha
3. Soy beans
5. Waste cooking oil
4. Rapeseeds
Vegetable oil
Changes in land usage
Competition with other uses
including food production
No changes in land usage
No competition with other uses
Changes in land usage
Cultivation on an abandoned
farmland
Indonesia
and Malaysia
Domestic
production
Waste cooking
oil
Options
(Biomass source)
Feedstock
Land usage and competition
Producer
countries
India,
Indonesia,
Malaysia, and
Philippines
USA
Fig. 15.2 Supply options for biodiesel in Japan
15 National Strategy Options for Japan
reviewed to identify differences among biomass sources. The maximum supply
capacities of domestic options such as rice straw ethanol and waste cooking oil were
calculated on the basis of domestic production and consumption of each biomass
source (Table 15.3). Due to the variation in CF and WF values within the same biomass source, we used both upper-end and lower-end values as best case and worst
case while calculating EF. Table 15.4 summarizes the domestic biofuel ratio (%) of
each case and the target year. Unless Japan cannot expand the maximum supply
capacity of the domestic options (Table 15.3), the domestic biofuel ratio will
decrease owing to the increase in imported biofuel, which is necessary to fill the gap
between domestic production and the targets, as described in Table 15.2.
4. Construction wasted
wood ethanol
Sugar
Cellulose
(woody)
Cellulose
(herbaceous)
Options
(Biomass source)
Feedstock
Land use and competition
Producer
countries
1. Maize
2. Sugarcane
3. Sweet sorghum
4. Construction waste
wood
5. Rice straw
Starch
Changes in land usage
Competition with food production
Changes in land usage
Cultivation on an abandoned
farmland
No change in land usage
Competition with direct combustion
No change in land usage
Competition with feedstuff and
compost materials
USA
Domestic
production
Brazil
Fig. 15.1 Supply options for bioethanol in Japan
1. Oil palm
2. Jatropha
3. Soy beans
5. Waste cooking oil
4. Rapeseeds
Vegetable oil
Changes in land usage
Competition with other uses
including food production
No changes in land usage
No competition with other uses
Changes in land usage
Cultivation on an abandoned
farmland
Indonesia
and Malaysia
Domestic
production
Waste cooking
oil
Options
(Biomass source)
Feedstock
Land usage and competition
Producer
countries
India,
Indonesia,
Malaysia, and
Philippines
USA
Fig. 15.2 Supply options for biodiesel in Japan
15 National Strategy Options for Japan