

194
The positive opinions we got from the subjects include:
• Visualization of conceptual maps is helpful to understand in what respects we are
different by identifying what concepts we share and don’t from the map.
• It sometimes helps us to realize the issues better by explicating unexpected relations or dependencies between concepts.
• It is useful for organizing my opinion to enable smooth discussion.
• It is useful to reveal overlap and distinction between us objectively.
These show the feasibility and utility of the system to some extent.
Comparison between the discussion done by groups A and B shows something
interesting. While there is no significant differences of number of utterances between
them, the number of utterances appearing the second discussion done by group A is
significantly smaller than that of the second discussions done by group B. This was
partly because the subjects in group A took much time to learn how to use the system so that they did not have enough time to perform discussion. In fact, we had
quite a few requests on improvement of the mapping tool. Furthermore, we found
the discussion done by group B which includes quite a few concepts that are not
covered by the current ontology. These facts suggest the system needs further
improvement on its usability and extension of the ontology to cover wider and
deeper topics. We plan to implement these modifications of the system to realize a
useful and usable system for facilitating consensus making for policy making of
biofuel production and utilization.
12.5 Conclusion
In this section, we proposed a consensus-building supporting system based on
ontology exploration. The system generates conceptual maps through ontology
exploration by the users. Because the generated maps represent the users’ viewpoints to understand the target domains of the ontology, it could show differences of
viewpoints through comparisons of them. In order to evaluate the system, we made
0
1 0
2 0
3 0
4 0
5 0
6 0
a: Industry b:Government
a: Industry c:Employees
a: Industry d: Environmental NGO
b:Government c:Employees
b:Government d: Environmental NGO
c:Employees d: Environmental NGO
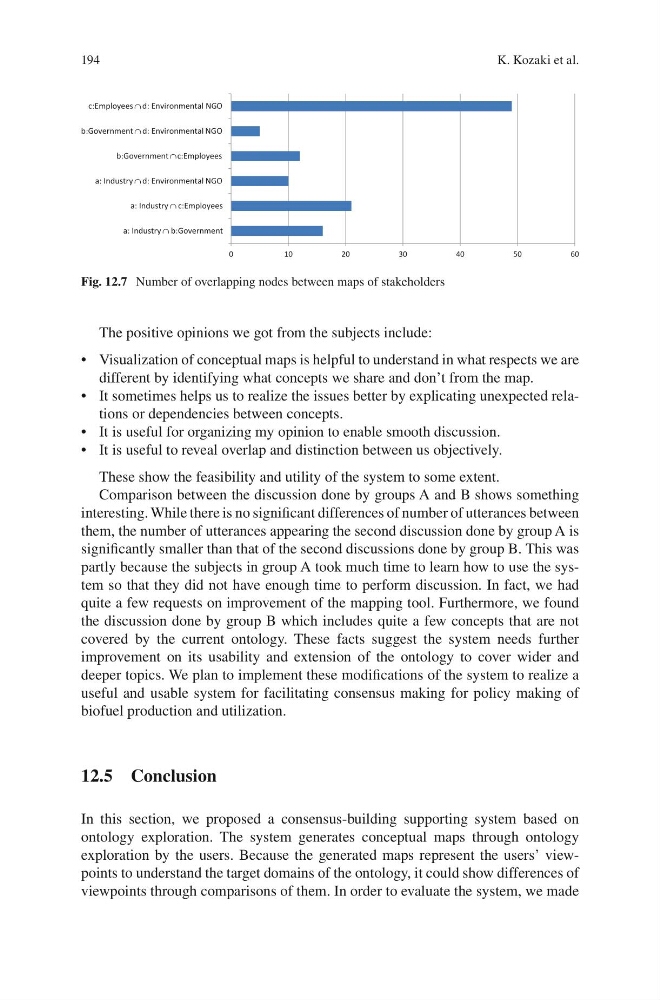
Fig. 12.7 Number of overlapping nodes between maps of stakeholders
K. Kozaki et al.
The positive opinions we got from the subjects include:
• Visualization of conceptual maps is helpful to understand in what respects we are
different by identifying what concepts we share and don’t from the map.
• It sometimes helps us to realize the issues better by explicating unexpected relations or dependencies between concepts.
• It is useful for organizing my opinion to enable smooth discussion.
• It is useful to reveal overlap and distinction between us objectively.
These show the feasibility and utility of the system to some extent.
Comparison between the discussion done by groups A and B shows something
interesting. While there is no significant differences of number of utterances between
them, the number of utterances appearing the second discussion done by group A is
significantly smaller than that of the second discussions done by group B. This was
partly because the subjects in group A took much time to learn how to use the system so that they did not have enough time to perform discussion. In fact, we had
quite a few requests on improvement of the mapping tool. Furthermore, we found
the discussion done by group B which includes quite a few concepts that are not
covered by the current ontology. These facts suggest the system needs further
improvement on its usability and extension of the ontology to cover wider and
deeper topics. We plan to implement these modifications of the system to realize a
useful and usable system for facilitating consensus making for policy making of
biofuel production and utilization.
12.5 Conclusion
In this section, we proposed a consensus-building supporting system based on
ontology exploration. The system generates conceptual maps through ontology
exploration by the users. Because the generated maps represent the users’ viewpoints to understand the target domains of the ontology, it could show differences of
viewpoints through comparisons of them. In order to evaluate the system, we made
0
1 0
2 0
3 0
4 0
5 0
6 0
a: Industry b:Government
a: Industry c:Employees
a: Industry d: Environmental NGO
b:Government c:Employees
b:Government d: Environmental NGO
c:Employees d: Environmental NGO
Fig. 12.7 Number of overlapping nodes between maps of stakeholders
K. Kozaki et al.