

193
12.4.2.3 Results and Discussion
Table 12.2 shows the number of nodes included in each map built by each subject in
group A and those of the overlapping nodes between them. The numbers of overlapping nodes indicate the how much the stakeholders share common interests
(Fig. 12.7). Comparison between these numbers reveals that employees and environmental NGO share a lot of common interests. This interpretation is supported by
the fact that both employees and environmental NGO are classified into the same
category citizen in the result of stakeholder analysis (Shiroyama et al. 2010). We
believe such a function that derives quantitative information between stakeholders
is one of the merits of the system. In addition to this, we found a couple of results
which show particular relations between stakeholders which we did not expected
before.
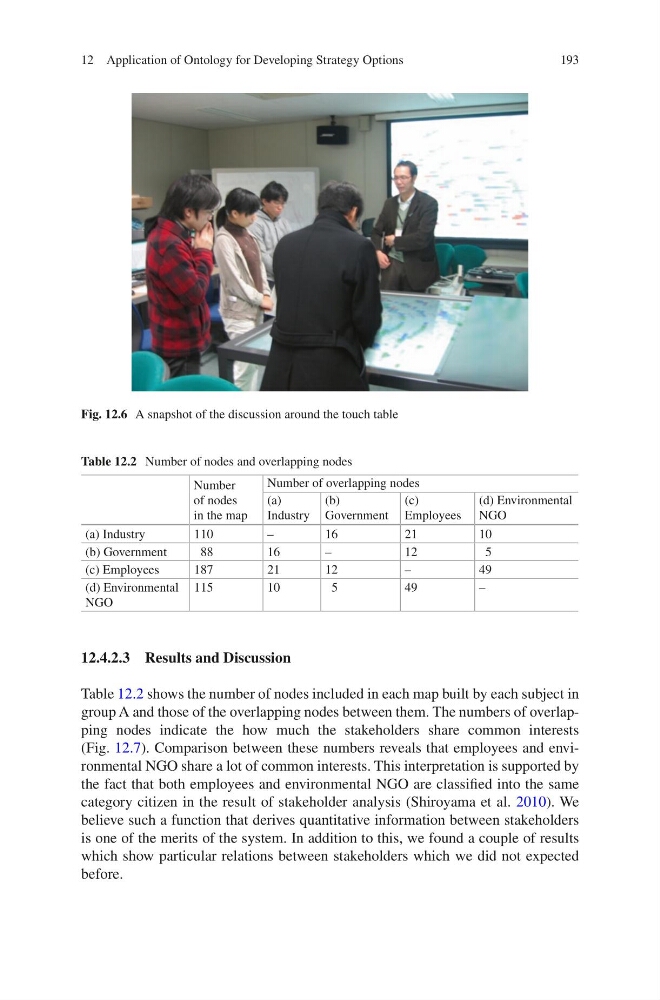
Fig. 12.6 A snapshot of the discussion around the touch table
Table 12.2 Number of nodes and overlapping nodes
Number
of nodes
in the map
Number of overlapping nodes
(a)
Industry
(b)
Government
(c)
Employees
(d) Environmental
NGO
(a) Industry
110
–
16
21
10
(b) Government
88
16
–
12
5
(c) Employees
187
21
12
–
49
(d) Environmental
NGO
115
10
5
49
–
12 Application of Ontology for Developing Strategy Options
12.4.2.3 Results and Discussion
Table 12.2 shows the number of nodes included in each map built by each subject in
group A and those of the overlapping nodes between them. The numbers of overlapping nodes indicate the how much the stakeholders share common interests
(Fig. 12.7). Comparison between these numbers reveals that employees and environmental NGO share a lot of common interests. This interpretation is supported by
the fact that both employees and environmental NGO are classified into the same
category citizen in the result of stakeholder analysis (Shiroyama et al. 2010). We
believe such a function that derives quantitative information between stakeholders
is one of the merits of the system. In addition to this, we found a couple of results
which show particular relations between stakeholders which we did not expected
before.
Fig. 12.6 A snapshot of the discussion around the touch table
Table 12.2 Number of nodes and overlapping nodes
Number
of nodes
in the map
Number of overlapping nodes
(a)
Industry
(b)
Government
(c)
Employees
(d) Environmental
NGO
(a) Industry
110
–
16
21
10
(b) Government
88
16
–
12
5
(c) Employees
187
21
12
–
49
(d) Environmental
NGO
115
10
5
49
–
12 Application of Ontology for Developing Strategy Options