

154
On the other hand, “0” was the second most popular response for only three
impact categories: “soil fertility,” “soil erosion,” and “agrochemical use.” This trend
might have been due to the realization by oil palm producers of the importance of
healthy soil for the sustainability of their firms and as a result taking the necessary
actions to maintain good soil quality prior to the launching of the RSPO certification
scheme.
0.00
1.00
2.00
3.00
Income
Health
Land titles
Labor
standards
Social conflict
Water quality
and quantity
Air pollution
Waste
Soil fertility
Soil erosion
Climate
Invasive
species
Agrochemical
use
Biodiversity
Final consumers,
investors
Large producers
Processors,
distributors
Small producers
0.00
1.00
2.00
3.00
Income
Health
Land titles
Labor
standards
Social conflict
Water quality
and quantity
Air pollution
Waste
Soil fertility
Soil erosion
Climate
Invasive species
Agrochemical
use
Biodiversity
Academia
Certifiers
Consultancy
NGO
Other/NA
a
b
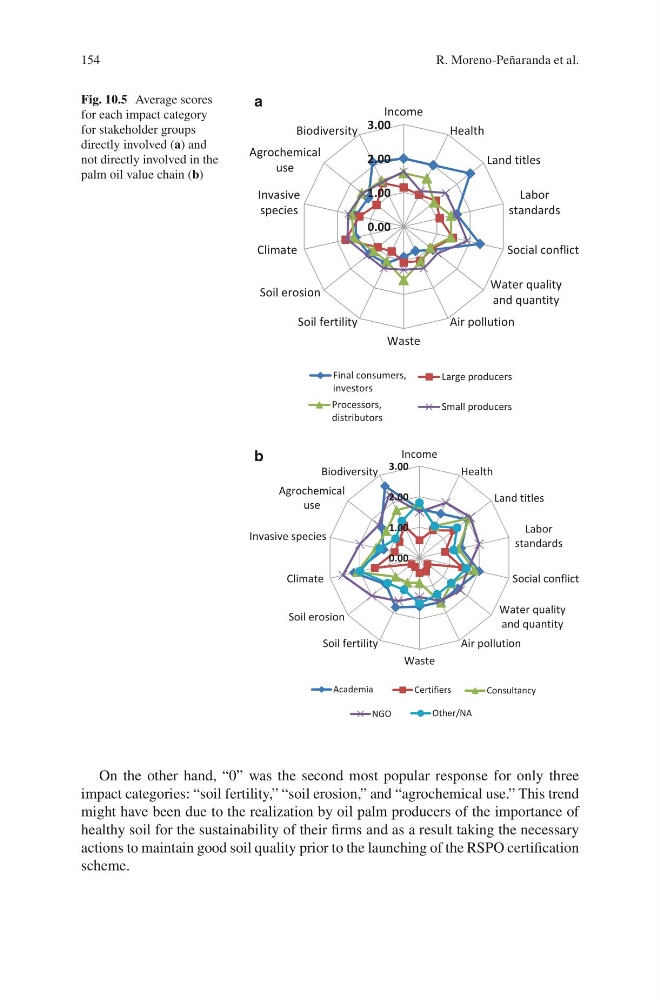
Fig. 10.5 Average scores
for each impact category
for stakeholder groups
directly involved (a) and
not directly involved in the
palm oil value chain (b)
R. Moreno-Peñaranda et al.
On the other hand, “0” was the second most popular response for only three
impact categories: “soil fertility,” “soil erosion,” and “agrochemical use.” This trend
might have been due to the realization by oil palm producers of the importance of
healthy soil for the sustainability of their firms and as a result taking the necessary
actions to maintain good soil quality prior to the launching of the RSPO certification
scheme.
0.00
1.00
2.00
3.00
Income
Health
Land titles
Labor
standards
Social conflict
Water quality
and quantity
Air pollution
Waste
Soil fertility
Soil erosion
Climate
Invasive
species
Agrochemical
use
Biodiversity
Final consumers,
investors
Large producers
Processors,
distributors
Small producers
0.00
1.00
2.00
3.00
Income
Health
Land titles
Labor
standards
Social conflict
Water quality
and quantity
Air pollution
Waste
Soil fertility
Soil erosion
Climate
Invasive species
Agrochemical
use
Biodiversity
Academia
Certifiers
Consultancy
NGO
Other/NA
a
b
Fig. 10.5 Average scores
for each impact category
for stakeholder groups
directly involved (a) and
not directly involved in the
palm oil value chain (b)
R. Moreno-Peñaranda et al.