

152
10.4.2 RSPO-RT8 Stakeholder Survey
A total of 139 questionnaires were returned with the response rate estimated at
25.3% based on the average number of attendees per plenary session (550 persons
according to in situ observations). The response rates for each individual question
varied across the 14 fixed-range questions, with questions in the front page of the
questionnaire being answered more frequently than those on the back side.
Quantitative responses to all 14 questions were included in 86 questionnaires, while
the response rate to the question regarding the involvement/interest of the respondent in palm oil biodiesel was markedly lower.
10.4.2.1 Quantitative Analysis
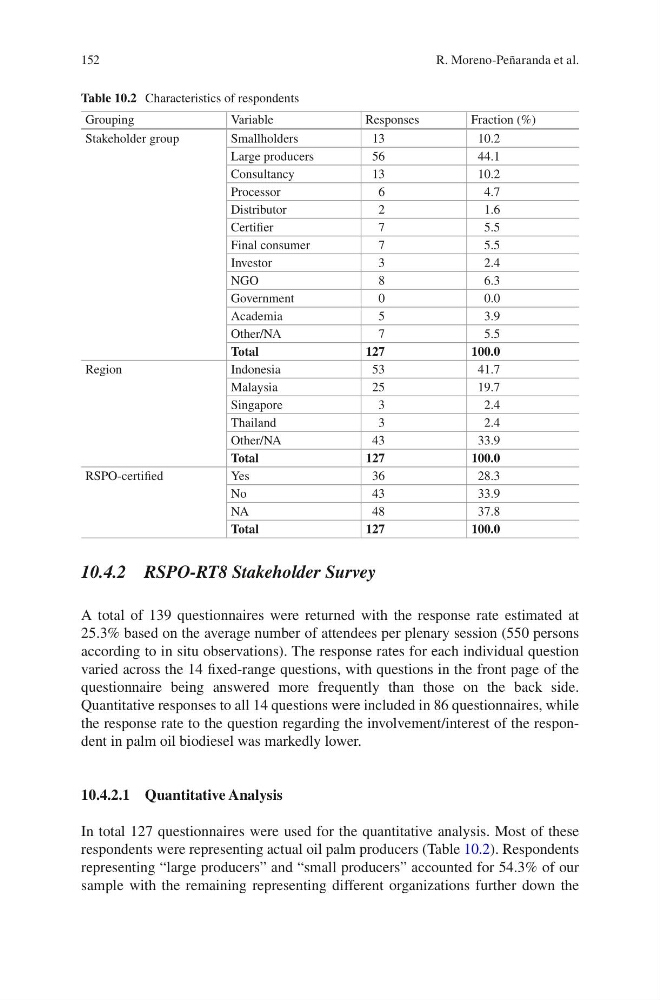
In total 127 questionnaires were used for the quantitative analysis. Most of these
respondents were representing actual oil palm producers (Table 10.2). Respondents
representing “large producers” and “small producers” accounted for 54.3% of our
sample with the remaining representing different organizations further down the
Table 10.2 Characteristics of respondents
Grouping
Variable
Responses
Fraction (%)
Stakeholder group
Smallholders
13
10.2
Large producers
56
44.1
Consultancy
13
10.2
Processor
6
4.7
Distributor
2
1.6
Certifier
7
5.5
Final consumer
7
5.5
Investor
3
2.4
NGO
8
6.3
Government
0
0.0
Academia
5
3.9
Other/NA
7
5.5
Total
127
100.0
Region
Indonesia
53
41.7
Malaysia
25
19.7
Singapore
3
2.4
Thailand
3
2.4
Other/NA
43
33.9
Total
127
100.0
RSPO-certified
Yes
36
28.3
No
43
33.9
NA
48
37.8
Total
127
100.0
R. Moreno-Peñaranda et al.
10.4.2 RSPO-RT8 Stakeholder Survey
A total of 139 questionnaires were returned with the response rate estimated at
25.3% based on the average number of attendees per plenary session (550 persons
according to in situ observations). The response rates for each individual question
varied across the 14 fixed-range questions, with questions in the front page of the
questionnaire being answered more frequently than those on the back side.
Quantitative responses to all 14 questions were included in 86 questionnaires, while
the response rate to the question regarding the involvement/interest of the respondent in palm oil biodiesel was markedly lower.
10.4.2.1 Quantitative Analysis
In total 127 questionnaires were used for the quantitative analysis. Most of these
respondents were representing actual oil palm producers (Table 10.2). Respondents
representing “large producers” and “small producers” accounted for 54.3% of our
sample with the remaining representing different organizations further down the
Table 10.2 Characteristics of respondents
Grouping
Variable
Responses
Fraction (%)
Stakeholder group
Smallholders
13
10.2
Large producers
56
44.1
Consultancy
13
10.2
Processor
6
4.7
Distributor
2
1.6
Certifier
7
5.5
Final consumer
7
5.5
Investor
3
2.4
NGO
8
6.3
Government
0
0.0
Academia
5
3.9
Other/NA
7
5.5
Total
127
100.0
Region
Indonesia
53
41.7
Malaysia
25
19.7
Singapore
3
2.4
Thailand
3
2.4
Other/NA
43
33.9
Total
127
100.0
RSPO-certified
Yes
36
28.3
No
43
33.9
NA
48
37.8
Total
127
100.0
R. Moreno-Peñaranda et al.