

29
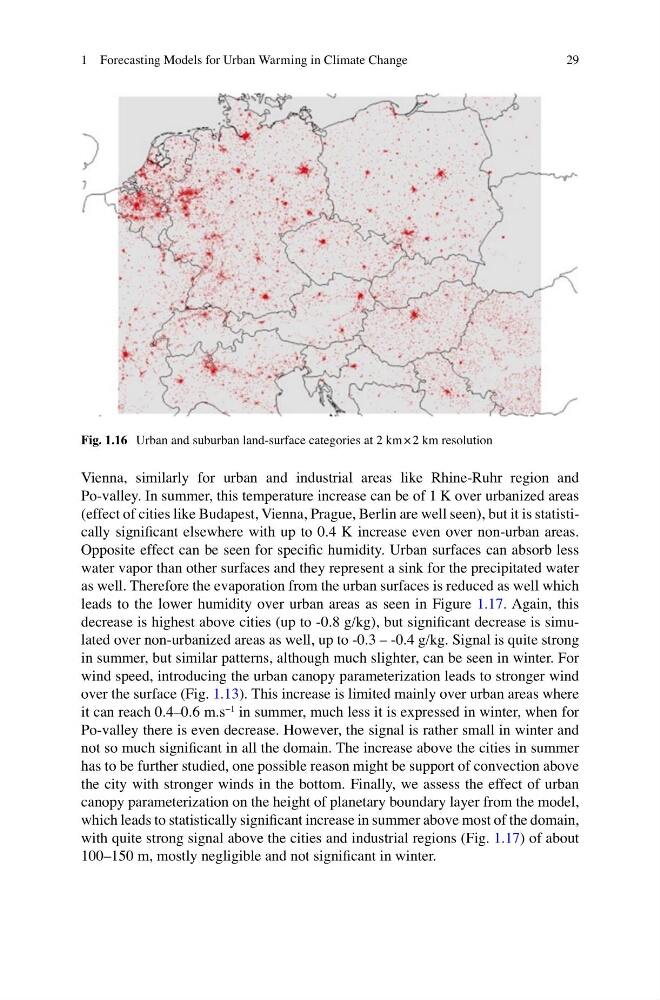
Fig. 1.16 Urban and suburban land-surface categories at 2 km × 2 km resolution
Vienna, similarly for urban and industrial areas like Rhine-Ruhr region and
Po-valley. In summer, this temperature increase can be of 1 K over urbanized areas
(effect of cities like Budapest, Vienna, Prague, Berlin are well seen), but it is statistically significant elsewhere with up to 0.4 K increase even over non-urban areas.
Opposite effect can be seen for specific humidity. Urban surfaces can absorb less
water vapor than other surfaces and they represent a sink for the precipitated water
as well. Therefore the evaporation from the urban surfaces is reduced as well which
leads to the lower humidity over urban areas as seen in Figure 1.17. Again, this
decrease is highest above cities (up to -0.8 g/kg), but significant decrease is simulated over non-urbanized areas as well, up to -0.3 – -0.4 g/kg. Signal is quite strong
in summer, but similar patterns, although much slighter, can be seen in winter. For
wind speed, introducing the urban canopy parameterization leads to stronger wind
over the surface (Fig. 1.13). This increase is limited mainly over urban areas where
it can reach 0.4–0.6 m.s
−1 in summer, much less it is expressed in winter, when for
Po-valley there is even decrease. However, the signal is rather small in winter and
not so much significant in all the domain. The increase above the cities in summer
has to be further studied, one possible reason might be support of convection above
the city with stronger winds in the bottom. Finally, we assess the effect of urban
canopy parameterization on the height of planetary boundary layer from the model,
which leads to statistically significant increase in summer above most of the domain,
with quite strong signal above the cities and industrial regions (Fig. 1.17) of about
100–150 m, mostly negligible and not significant in winter.
1 Forecasting Models for Urban Warming in Climate Change
Fig. 1.16 Urban and suburban land-surface categories at 2 km × 2 km resolution
Vienna, similarly for urban and industrial areas like Rhine-Ruhr region and
Po-valley. In summer, this temperature increase can be of 1 K over urbanized areas
(effect of cities like Budapest, Vienna, Prague, Berlin are well seen), but it is statistically significant elsewhere with up to 0.4 K increase even over non-urban areas.
Opposite effect can be seen for specific humidity. Urban surfaces can absorb less
water vapor than other surfaces and they represent a sink for the precipitated water
as well. Therefore the evaporation from the urban surfaces is reduced as well which
leads to the lower humidity over urban areas as seen in Figure 1.17. Again, this
decrease is highest above cities (up to -0.8 g/kg), but significant decrease is simulated over non-urbanized areas as well, up to -0.3 – -0.4 g/kg. Signal is quite strong
in summer, but similar patterns, although much slighter, can be seen in winter. For
wind speed, introducing the urban canopy parameterization leads to stronger wind
over the surface (Fig. 1.13). This increase is limited mainly over urban areas where
it can reach 0.4–0.6 m.s
−1 in summer, much less it is expressed in winter, when for
Po-valley there is even decrease. However, the signal is rather small in winter and
not so much significant in all the domain. The increase above the cities in summer
has to be further studied, one possible reason might be support of convection above
the city with stronger winds in the bottom. Finally, we assess the effect of urban
canopy parameterization on the height of planetary boundary layer from the model,
which leads to statistically significant increase in summer above most of the domain,
with quite strong signal above the cities and industrial regions (Fig. 1.17) of about
100–150 m, mostly negligible and not significant in winter.
1 Forecasting Models for Urban Warming in Climate Change