

10
1.3.1.4 Conclusion
Delivering climate runs with higher resolution, which may fit better to the urban
scale will be very cost intensive. Nevertheless, results from projects like the abovementioned one can be used as boundary conditions for high resolution city-scale
models to conduct scenario runs (e.g. different urban planning strategies) for future
climate conditions and region of interest. For further studies on impact of climate
change on urban settlements please refer also to the project Ensembles-Based
Predictions of Climate Changes and Their Impacts – ENSEMBLES (Hewitt CD
2005). This study can be used for other working packages dealing with mitigation
and adaptation strategies, with the background that climate change will amplify
Urban Heat Islands and future problems for urban inhabitants coming along with
that phenomenon. Specific measures like urban greening, changing radiative properties of building materials or restructuring of city quarters, are not discussed in this
report, rather should the results serve as basis for referring the problem of UHI’s to
a more to raise public awareness on a different level.
Table 1.1 Projected fine nest seasonal and annual temperature changes [°C] between 1971 and
2000 and 2021–2050 for the WRF simulation averaged for urban area
DJF
MAM
JJA
SON
Annual
Ljublijana
1.47
0.66
0.66
1.35
1.03
Modena
1.11
0.61
0.75
1.24
0.93
Padua
0.86
0.26
0.29
0.9
0.58
Vienna
1.92
1.04
1.13
1.91
1.5
Prague
1.43
0.05
0.07
1.13
0.67
Stuttgart
2.05
1.36
1.86
2.31
1.89
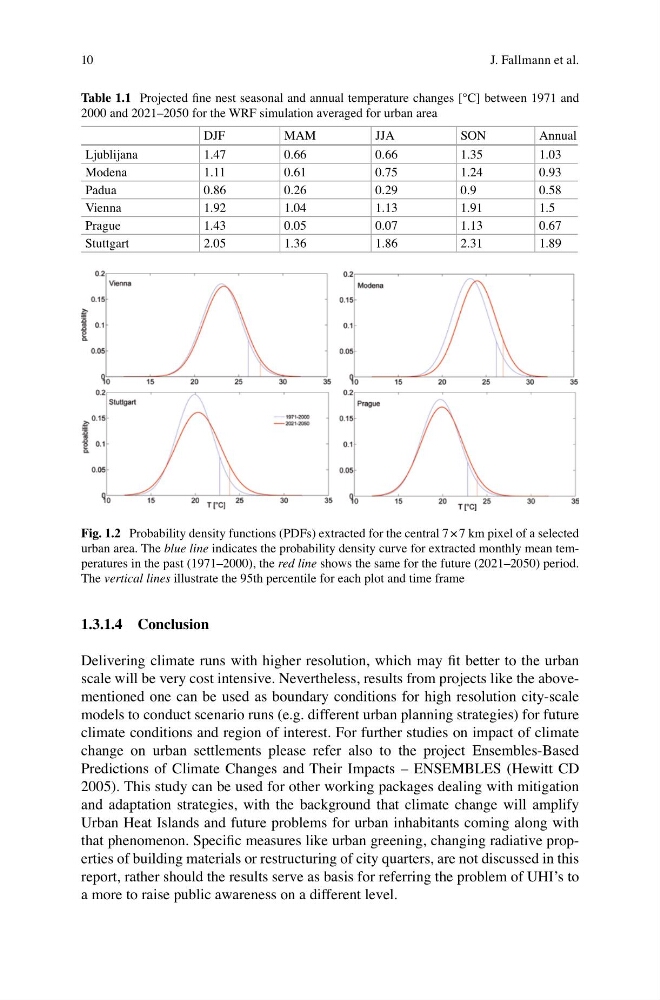
Fig. 1.2 Probability density functions (PDFs) extracted for the central 7 × 7 km pixel of a selected
urban area. The blue line indicates the probability density curve for extracted monthly mean temperatures in the past (1971–2000), the red line shows the same for the future (2021–2050) period.
The vertical lines illustrate the 95th percentile for each plot and time frame
J. Fallmann et al.
1.3.1.4 Conclusion
Delivering climate runs with higher resolution, which may fit better to the urban
scale will be very cost intensive. Nevertheless, results from projects like the abovementioned one can be used as boundary conditions for high resolution city-scale
models to conduct scenario runs (e.g. different urban planning strategies) for future
climate conditions and region of interest. For further studies on impact of climate
change on urban settlements please refer also to the project Ensembles-Based
Predictions of Climate Changes and Their Impacts – ENSEMBLES (Hewitt CD
2005). This study can be used for other working packages dealing with mitigation
and adaptation strategies, with the background that climate change will amplify
Urban Heat Islands and future problems for urban inhabitants coming along with
that phenomenon. Specific measures like urban greening, changing radiative properties of building materials or restructuring of city quarters, are not discussed in this
report, rather should the results serve as basis for referring the problem of UHI’s to
a more to raise public awareness on a different level.
Table 1.1 Projected fine nest seasonal and annual temperature changes [°C] between 1971 and
2000 and 2021–2050 for the WRF simulation averaged for urban area
DJF
MAM
JJA
SON
Annual
Ljublijana
1.47
0.66
0.66
1.35
1.03
Modena
1.11
0.61
0.75
1.24
0.93
Padua
0.86
0.26
0.29
0.9
0.58
Vienna
1.92
1.04
1.13
1.91
1.5
Prague
1.43
0.05
0.07
1.13
0.67
Stuttgart
2.05
1.36
1.86
2.31
1.89
Fig. 1.2 Probability density functions (PDFs) extracted for the central 7 × 7 km pixel of a selected
urban area. The blue line indicates the probability density curve for extracted monthly mean temperatures in the past (1971–2000), the red line shows the same for the future (2021–2050) period.
The vertical lines illustrate the 95th percentile for each plot and time frame
J. Fallmann et al.