

9
1.3.1.3 Results
All simulation results project a significant warming throughout the model domain
between 0.8 and 1.1 K. All ECHAM5 driven regional climate models predict an
increase of annual precipitation in the range of 2 to 9 % (average of 3 % for
Germany), with higher values in winter and autumn months. Using WRF as RCM
reveals changes of temperature and precipitation (Wagner 2013). Differences in 2 m
temperature between future and past regional climate model run, extracted for certain urban areas located in the model domain and in the project region Central
Europe reveal the following trends (Table 1.1).
Monthly mean temperatures are extracted for one grid cell in the centre of a
selected urban region to create probability density functions in order to statistically
compare the modelling results. By calculating the values to fall below the 5 % confidence interval, the tendency towards extreme values is to be analysed on the basis
of the comparison of the future (2021–2050) with the reference period (1971–2000).
Probability density functions (PDF) for 4 selected cities are presented in Fig. 1.2.
Following the expectations given by the IPCC AR4, temperatures will develop in
direction to the extremes (Beniston et al. 2007). The PDFs indicate a compression
and widening of the future curve compared to that one of the past. The shift in the
95th percentile reflects the climate change signal.
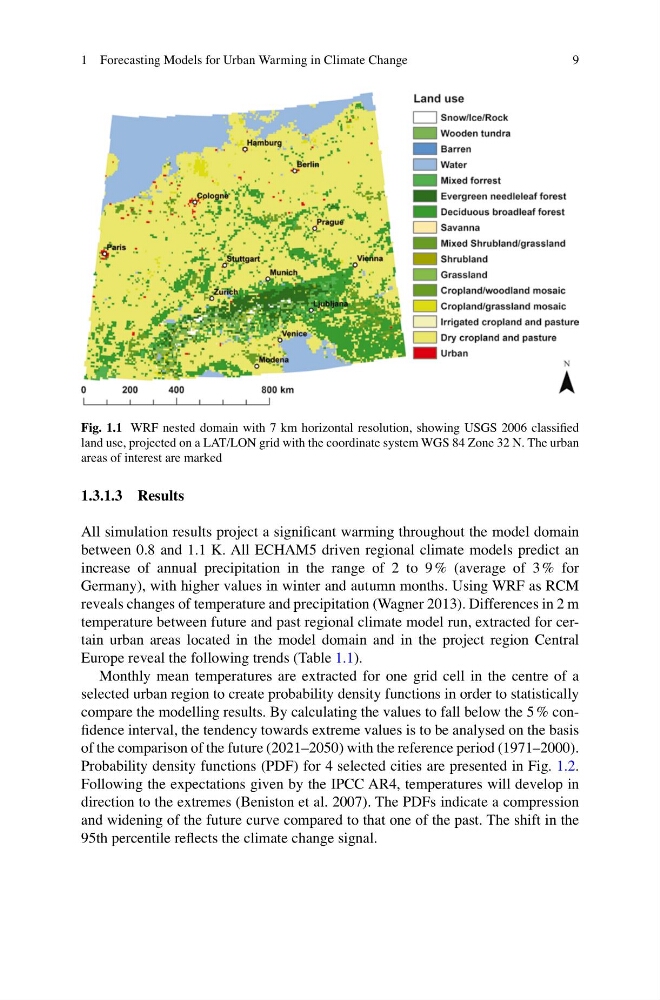
Fig. 1.1 WRF nested domain with 7 km horizontal resolution, showing USGS 2006 classified
land use, projected on a LAT/LON grid with the coordinate system WGS 84 Zone 32 N. The urban
areas of interest are marked
1 Forecasting Models for Urban Warming in Climate Change
1.3.1.3 Results
All simulation results project a significant warming throughout the model domain
between 0.8 and 1.1 K. All ECHAM5 driven regional climate models predict an
increase of annual precipitation in the range of 2 to 9 % (average of 3 % for
Germany), with higher values in winter and autumn months. Using WRF as RCM
reveals changes of temperature and precipitation (Wagner 2013). Differences in 2 m
temperature between future and past regional climate model run, extracted for certain urban areas located in the model domain and in the project region Central
Europe reveal the following trends (Table 1.1).
Monthly mean temperatures are extracted for one grid cell in the centre of a
selected urban region to create probability density functions in order to statistically
compare the modelling results. By calculating the values to fall below the 5 % confidence interval, the tendency towards extreme values is to be analysed on the basis
of the comparison of the future (2021–2050) with the reference period (1971–2000).
Probability density functions (PDF) for 4 selected cities are presented in Fig. 1.2.
Following the expectations given by the IPCC AR4, temperatures will develop in
direction to the extremes (Beniston et al. 2007). The PDFs indicate a compression
and widening of the future curve compared to that one of the past. The shift in the
95th percentile reflects the climate change signal.
Fig. 1.1 WRF nested domain with 7 km horizontal resolution, showing USGS 2006 classified
land use, projected on a LAT/LON grid with the coordinate system WGS 84 Zone 32 N. The urban
areas of interest are marked
1 Forecasting Models for Urban Warming in Climate Change