

315
It is also hypothesized that combinations of those factors, in addition to triggering
respiratory tract allergy symptoms, can also promote allergisation in the portion of
the population so far unaffected by allergies, by facilitation of allergen penetration
into the respiratory tract (Lovasi et al. 2013 ). The deeper the allergen can reach into
the respiratory tract, the greater area of mucosa is affected and the longer the allergen stays inside the organism, the more severe allergy symptoms can be triggered as
well as easier allergisation. Air pollution itself also facilitates allergisation. It can
irritate respiratory tract mucosa, thus causing it to be more easily penetrated by
allergen proteins. Another factor that can affect people susceptible to seasonal airborne allergens is the elongation of the pollen season (Bielory et al. 2012 ). In a
warmer climate, plants start to pollinate earlier and continue to release pollens for
longer periods. It causes the anti-allergic pharmacology therapy schedule and specifi c immunotherapy calendar to require additional modifi cation (early implementation, prolonged administration). All facts described above indicate that suitable
plant selection is essential for successful implementation of various greenery- related
UHI adaptation and mitigation strategies. It is also important to remember that all
plant allergenicity assessment is local-specifi c. The set of allergy patterns is different for various geographic regions. The best example is the allergy to olive trees,
which is known to be a frequent allergy in the Mediterranean region but not in north
of Europe. Therefore, for performing such an assessment, the cooperation of local
urbanists, botanists and allergists is needed to develop a suiTab. model of plant
cover for UHI mitigation and adaptation strategies.
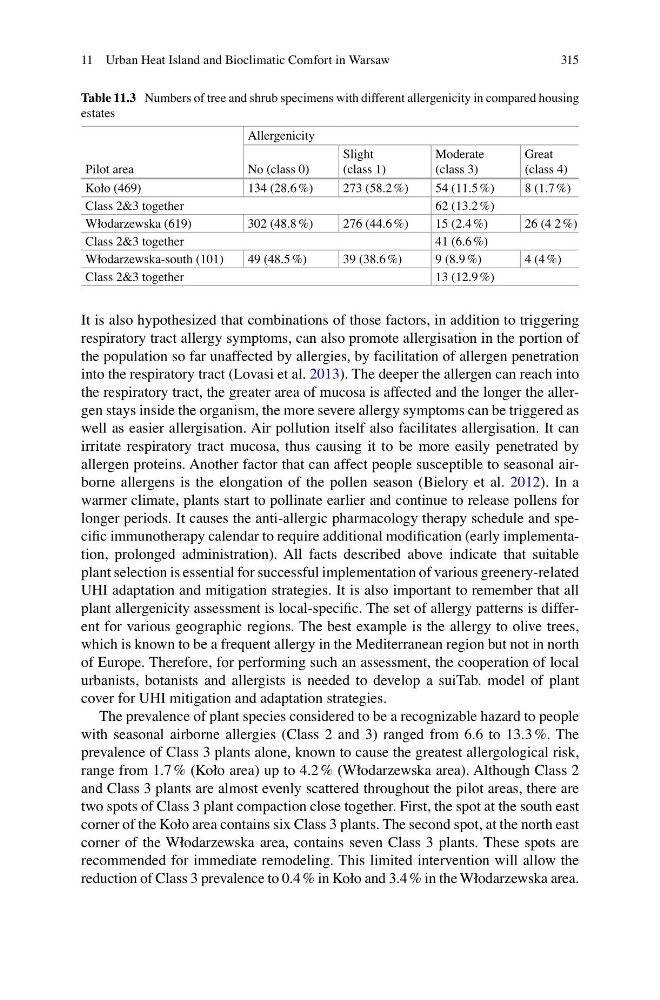
The prevalence of plant species considered to be a recognizable hazard to people
with seasonal airborne allergies (Class 2 and 3) ranged from 6.6 to 13.3 %. The
prevalence of Class 3 plants alone, known to cause the greatest allergological risk,
range from 1.7 % (Koło area) up to 4.2 % (Włodarzewska area). Although Class 2
and Class 3 plants are almost evenly scattered throughout the pilot areas, there are
two spots of Class 3 plant compaction close together. First, the spot at the south east
corner of the Koło area contains six Class 3 plants. The second spot, at the north east
corner of the Włodarzewska area, contains seven Class 3 plants. These spots are
recommended for immediate remodeling. This limited intervention will allow the
reduction of Class 3 prevalence to 0.4 % in Koło and 3.4 % in the Włodarzewska area.
Table 11.3 Numbers of tree and shrub specimens with different allergenicity in compared housing
estates
Pilot area
Allergenicity
No (class 0)
Slight
(class 1)
Moderate
(class 3)
Great
(class 4)
Koło (469)
134 (28.6 %)
273 (58.2 %)
54 (11.5 %)
8 (1.7 %)
Class 2&3 together
62 (13.2 %)
Włodarzewska (619)
302 (48.8 %)
276 (44.6 %)
15 (2.4 %)
26 (4 2 %)
Class 2&3 together
41 (6.6 %)
Włodarzewska-south (101)
49 (48.5 %)
39 (38.6 %)
9 (8.9 %)
4 (4 %)
Class 2&3 together
13 (12.9 %)
11 Urban Heat Island and Bioclimatic Comfort in Warsaw
It is also hypothesized that combinations of those factors, in addition to triggering
respiratory tract allergy symptoms, can also promote allergisation in the portion of
the population so far unaffected by allergies, by facilitation of allergen penetration
into the respiratory tract (Lovasi et al. 2013 ). The deeper the allergen can reach into
the respiratory tract, the greater area of mucosa is affected and the longer the allergen stays inside the organism, the more severe allergy symptoms can be triggered as
well as easier allergisation. Air pollution itself also facilitates allergisation. It can
irritate respiratory tract mucosa, thus causing it to be more easily penetrated by
allergen proteins. Another factor that can affect people susceptible to seasonal airborne allergens is the elongation of the pollen season (Bielory et al. 2012 ). In a
warmer climate, plants start to pollinate earlier and continue to release pollens for
longer periods. It causes the anti-allergic pharmacology therapy schedule and specifi c immunotherapy calendar to require additional modifi cation (early implementation, prolonged administration). All facts described above indicate that suitable
plant selection is essential for successful implementation of various greenery- related
UHI adaptation and mitigation strategies. It is also important to remember that all
plant allergenicity assessment is local-specifi c. The set of allergy patterns is different for various geographic regions. The best example is the allergy to olive trees,
which is known to be a frequent allergy in the Mediterranean region but not in north
of Europe. Therefore, for performing such an assessment, the cooperation of local
urbanists, botanists and allergists is needed to develop a suiTab. model of plant
cover for UHI mitigation and adaptation strategies.
The prevalence of plant species considered to be a recognizable hazard to people
with seasonal airborne allergies (Class 2 and 3) ranged from 6.6 to 13.3 %. The
prevalence of Class 3 plants alone, known to cause the greatest allergological risk,
range from 1.7 % (Koło area) up to 4.2 % (Włodarzewska area). Although Class 2
and Class 3 plants are almost evenly scattered throughout the pilot areas, there are
two spots of Class 3 plant compaction close together. First, the spot at the south east
corner of the Koło area contains six Class 3 plants. The second spot, at the north east
corner of the Włodarzewska area, contains seven Class 3 plants. These spots are
recommended for immediate remodeling. This limited intervention will allow the
reduction of Class 3 prevalence to 0.4 % in Koło and 3.4 % in the Włodarzewska area.
Table 11.3 Numbers of tree and shrub specimens with different allergenicity in compared housing
estates
Pilot area
Allergenicity
No (class 0)
Slight
(class 1)
Moderate
(class 3)
Great
(class 4)
Koło (469)
134 (28.6 %)
273 (58.2 %)
54 (11.5 %)
8 (1.7 %)
Class 2&3 together
62 (13.2 %)
Włodarzewska (619)
302 (48.8 %)
276 (44.6 %)
15 (2.4 %)
26 (4 2 %)
Class 2&3 together
41 (6.6 %)
Włodarzewska-south (101)
49 (48.5 %)
39 (38.6 %)
9 (8.9 %)
4 (4 %)
Class 2&3 together
13 (12.9 %)
11 Urban Heat Island and Bioclimatic Comfort in Warsaw