

306
over 3.2 million residents of the greater agglomeration area, it has become the 10
th
most populous city in the European Union (Eurostat 2014 ). After the Second World
War, the area of Warsaw increased gradually; small villages and rural areas as well
as natural forests were included into the city.
During the last 20 years, many fi elds, pastures and meadows were adapted for
residential districts.
The recent tendency in city development is to build dense settled residential districts (both, small single family buildings and 4–6 fl oor blocks) as well as to insert
new buildings into free spaces in the city centre (which was dramatically destroyed
during the II World War). At the administration level of Warsaw there is not one
single vision for city development. For the whole city there is only a general overview of investment intentions (Studium… 2010 ).
The shape of UHI in Warsaw resembles a diamond and refl ects the distribution
of the densest built area. The mean yearly intensity of the UHI-index (difference of
the minimum daily temperature for the considered site to the value of the minimum
daily temperature for Warszawa-Okęcie station) reaches over 2 °C in the city centre.
On the outskirts and in the forest area in south-east Warsaw, the UHI-index is from
0.5 to 1.0 °C lower than at the airport station. During spring and summer, the intensity of UHI is comparable to the average. The most intensive UHI is to be observed
in autumn. The very centre of the city is warmer in the night by 2.5 °C comparing
to Okęcie station. The lowest UHI-index occurs in winter – only 1.5 °C, but then the
spatial extent of UHI is greater than in other seasons. This situation is associated
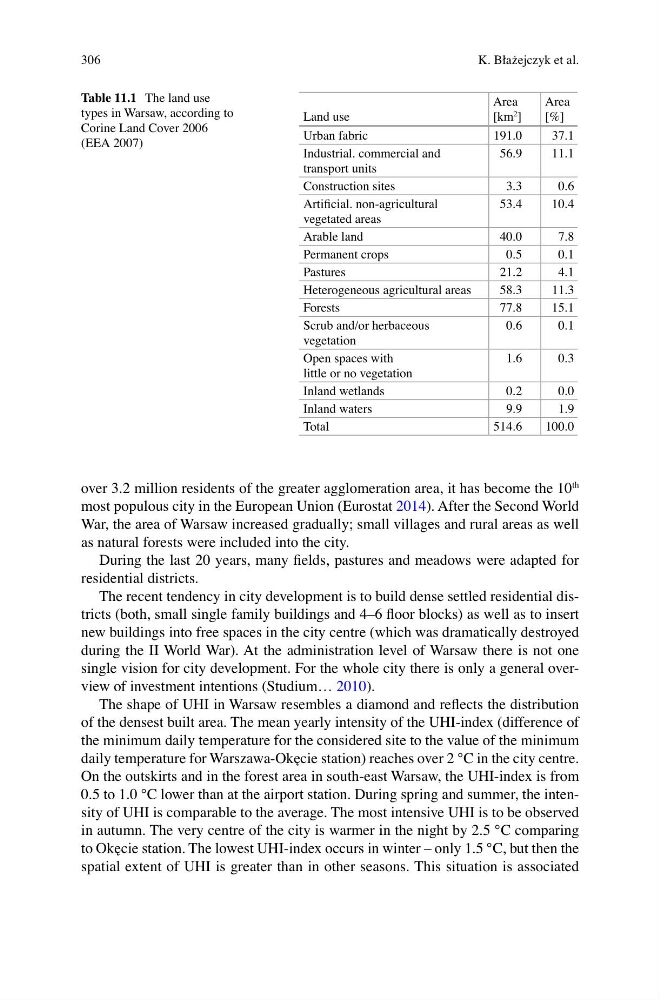
Table 11.1 The land use
types in Warsaw, according to
Corine Land Cover 2006
(EEA 2007)
Land use
Area
[km
2 ]
Area
[%]
Urban fabric
191.0
37.1
Industrial. commercial and
transport units
56.9
11.1
Construction sites
3.3
0.6
Artifi cial. non-agricultural
vegetated areas
53.4
10.4
Arable land
40.0
7.8
Permanent crops
0.5
0.1
Pastures
21.2
4.1
Heterogeneous agricultural areas
58.3
11.3
Forests
77.8
15.1
Scrub and/or herbaceous
vegetation
0.6
0.1
Open spaces with
little or no vegetation
1.6
0.3
Inland wetlands
0.2
0.0
Inland waters
9.9
1.9
Total
514.6
100.0
K. Błażejczyk et al.
over 3.2 million residents of the greater agglomeration area, it has become the 10
th
most populous city in the European Union (Eurostat 2014 ). After the Second World
War, the area of Warsaw increased gradually; small villages and rural areas as well
as natural forests were included into the city.
During the last 20 years, many fi elds, pastures and meadows were adapted for
residential districts.
The recent tendency in city development is to build dense settled residential districts (both, small single family buildings and 4–6 fl oor blocks) as well as to insert
new buildings into free spaces in the city centre (which was dramatically destroyed
during the II World War). At the administration level of Warsaw there is not one
single vision for city development. For the whole city there is only a general overview of investment intentions (Studium… 2010 ).
The shape of UHI in Warsaw resembles a diamond and refl ects the distribution
of the densest built area. The mean yearly intensity of the UHI-index (difference of
the minimum daily temperature for the considered site to the value of the minimum
daily temperature for Warszawa-Okęcie station) reaches over 2 °C in the city centre.
On the outskirts and in the forest area in south-east Warsaw, the UHI-index is from
0.5 to 1.0 °C lower than at the airport station. During spring and summer, the intensity of UHI is comparable to the average. The most intensive UHI is to be observed
in autumn. The very centre of the city is warmer in the night by 2.5 °C comparing
to Okęcie station. The lowest UHI-index occurs in winter – only 1.5 °C, but then the
spatial extent of UHI is greater than in other seasons. This situation is associated
Table 11.1 The land use
types in Warsaw, according to
Corine Land Cover 2006
(EEA 2007)
Land use
Area
[km
2 ]
Area
[%]
Urban fabric
191.0
37.1
Industrial. commercial and
transport units
56.9
11.1
Construction sites
3.3
0.6
Artifi cial. non-agricultural
vegetated areas
53.4
10.4
Arable land
40.0
7.8
Permanent crops
0.5
0.1
Pastures
21.2
4.1
Heterogeneous agricultural areas
58.3
11.3
Forests
77.8
15.1
Scrub and/or herbaceous
vegetation
0.6
0.1
Open spaces with
little or no vegetation
1.6
0.3
Inland wetlands
0.2
0.0
Inland waters
9.9
1.9
Total
514.6
100.0
K. Błażejczyk et al.