

103
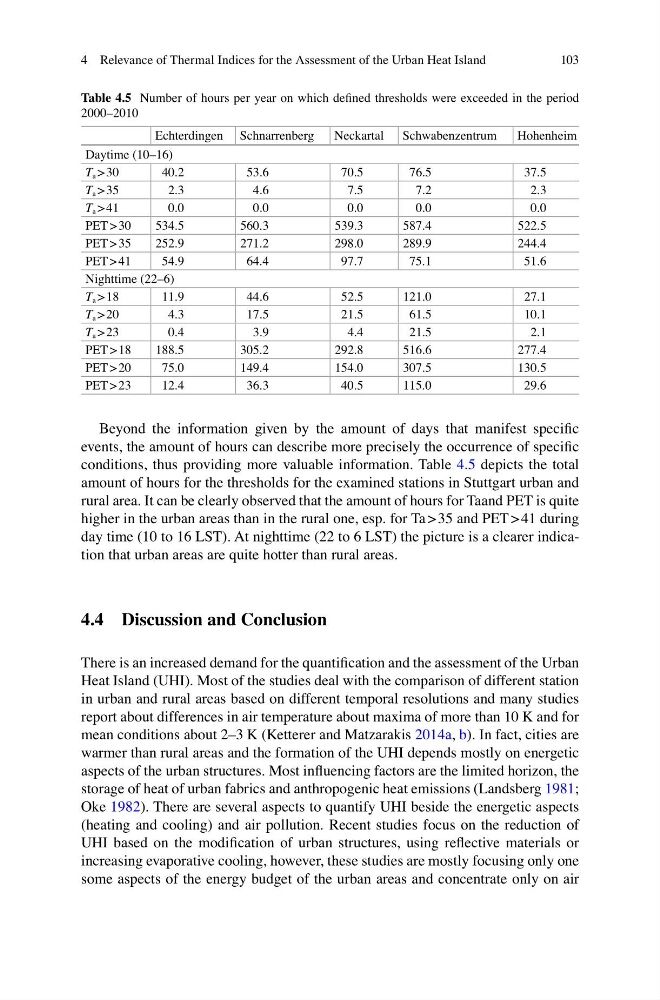
Beyond the information given by the amount of days that manifest specific
events, the amount of hours can describe more precisely the occurrence of specific
conditions, thus providing more valuable information. Table 4.5 depicts the total
amount of hours for the thresholds for the examined stations in Stuttgart urban and
rural area. It can be clearly observed that the amount of hours for Taand PET is quite
higher in the urban areas than in the rural one, esp. for Ta > 35 and PET > 41 during
day time (10 to 16 LST). At nighttime (22 to 6 LST) the picture is a clearer indication that urban areas are quite hotter than rural areas.
4.4 Discussion and Conclusion
There is an increased demand for the quantification and the assessment of the Urban
Heat Island (UHI). Most of the studies deal with the comparison of different station
in urban and rural areas based on different temporal resolutions and many studies
report about differences in air temperature about maxima of more than 10 K and for
mean conditions about 2–3 K (Ketterer and Matzarakis 2014a, b). In fact, cities are
warmer than rural areas and the formation of the UHI depends mostly on energetic
aspects of the urban structures. Most influencing factors are the limited horizon, the
storage of heat of urban fabrics and anthropogenic heat emissions (Landsberg 1981;
Oke 1982). There are several aspects to quantify UHI beside the energetic aspects
(heating and cooling) and air pollution. Recent studies focus on the reduction of
UHI based on the modification of urban structures, using reflective materials or
increasing evaporative cooling, however, these studies are mostly focusing only one
some aspects of the energy budget of the urban areas and concentrate only on air
Table 4.5 Number of hours per year on which defined thresholds were exceeded in the period
2000–2010
Echterdingen Schnarrenberg
Neckartal Schwabenzentrum
Hohenheim
Daytime (10–16)
T a > 30
40.2
53.6
70.5
76.5
37.5
T a > 35
2.3
4.6
7.5
7.2
2.3
T a > 41
0.0
0.0
0.0
0.0
0.0
PET > 30
534.5
560.3
539.3
587.4
522.5
PET > 35
252.9
271.2
298.0
289.9
244.4
PET > 41
54.9
64.4
97.7
75.1
51.6
Nighttime (22–6)
T a > 18
11.9
44.6
52.5
121.0
27.1
T a > 20
4.3
17.5
21.5
61.5
10.1
T a > 23
0.4
3.9
4.4
21.5
2.1
PET > 18
188.5
305.2
292.8
516.6
277.4
PET > 20
75.0
149.4
154.0
307.5
130.5
PET > 23
12.4
36.3
40.5
115.0
29.6
4 Relevance of Thermal Indices for the Assessment of the Urban Heat Island
Beyond the information given by the amount of days that manifest specific
events, the amount of hours can describe more precisely the occurrence of specific
conditions, thus providing more valuable information. Table 4.5 depicts the total
amount of hours for the thresholds for the examined stations in Stuttgart urban and
rural area. It can be clearly observed that the amount of hours for Taand PET is quite
higher in the urban areas than in the rural one, esp. for Ta > 35 and PET > 41 during
day time (10 to 16 LST). At nighttime (22 to 6 LST) the picture is a clearer indication that urban areas are quite hotter than rural areas.
4.4 Discussion and Conclusion
There is an increased demand for the quantification and the assessment of the Urban
Heat Island (UHI). Most of the studies deal with the comparison of different station
in urban and rural areas based on different temporal resolutions and many studies
report about differences in air temperature about maxima of more than 10 K and for
mean conditions about 2–3 K (Ketterer and Matzarakis 2014a, b). In fact, cities are
warmer than rural areas and the formation of the UHI depends mostly on energetic
aspects of the urban structures. Most influencing factors are the limited horizon, the
storage of heat of urban fabrics and anthropogenic heat emissions (Landsberg 1981;
Oke 1982). There are several aspects to quantify UHI beside the energetic aspects
(heating and cooling) and air pollution. Recent studies focus on the reduction of
UHI based on the modification of urban structures, using reflective materials or
increasing evaporative cooling, however, these studies are mostly focusing only one
some aspects of the energy budget of the urban areas and concentrate only on air
Table 4.5 Number of hours per year on which defined thresholds were exceeded in the period
2000–2010
Echterdingen Schnarrenberg
Neckartal Schwabenzentrum
Hohenheim
Daytime (10–16)
T a > 30
40.2
53.6
70.5
76.5
37.5
T a > 35
2.3
4.6
7.5
7.2
2.3
T a > 41
0.0
0.0
0.0
0.0
0.0
PET > 30
534.5
560.3
539.3
587.4
522.5
PET > 35
252.9
271.2
298.0
289.9
244.4
PET > 41
54.9
64.4
97.7
75.1
51.6
Nighttime (22–6)
T a > 18
11.9
44.6
52.5
121.0
27.1
T a > 20
4.3
17.5
21.5
61.5
10.1
T a > 23
0.4
3.9
4.4
21.5
2.1
PET > 18
188.5
305.2
292.8
516.6
277.4
PET > 20
75.0
149.4
154.0
307.5
130.5
PET > 23
12.4
36.3
40.5
115.0
29.6
4 Relevance of Thermal Indices for the Assessment of the Urban Heat Island