

80
for these areas (base case) were modelled using the aforementioned simulation
environment. Fourth, candidate mitigation measures were defined for each of these
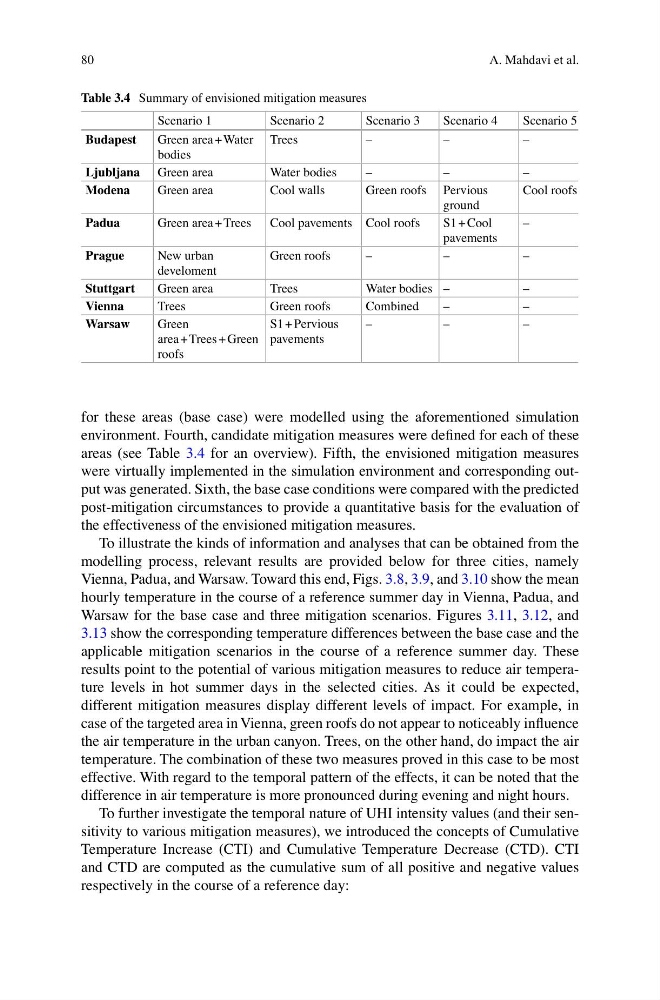
areas (see Table 3.4 for an overview). Fifth, the envisioned mitigation measures
were virtually implemented in the simulation environment and corresponding output was generated. Sixth, the base case conditions were compared with the predicted
post-mitigation circumstances to provide a quantitative basis for the evaluation of
the effectiveness of the envisioned mitigation measures.
To illustrate the kinds of information and analyses that can be obtained from the
modelling process, relevant results are provided below for three cities, namely
Vienna, Padua, and Warsaw. Toward this end, Figs. 3.8, 3.9, and 3.10 show the mean
hourly temperature in the course of a reference summer day in Vienna, Padua, and
Warsaw for the base case and three mitigation scenarios. Figures 3.11, 3.12, and
3.13 show the corresponding temperature differences between the base case and the
applicable mitigation scenarios in the course of a reference summer day. These
results point to the potential of various mitigation measures to reduce air temperature levels in hot summer days in the selected cities. As it could be expected,
different mitigation measures display different levels of impact. For example, in
case of the targeted area in Vienna, green roofs do not appear to noticeably influence
the air temperature in the urban canyon. Trees, on the other hand, do impact the air
temperature. The combination of these two measures proved in this case to be most
effective. With regard to the temporal pattern of the effects, it can be noted that the
difference in air temperature is more pronounced during evening and night hours.
To further investigate the temporal nature of UHI intensity values (and their sensitivity to various mitigation measures), we introduced the concepts of Cumulative
Temperature Increase (CTI) and Cumulative Temperature Decrease (CTD). CTI
and CTD are computed as the cumulative sum of all positive and negative values
respectively in the course of a reference day:
Table 3.4 Summary of envisioned mitigation measures
Scenario 1
Scenario 2
Scenario 3
Scenario 4
Scenario 5
Budapest
Green area + Water
bodies
Trees
–
–
–
Ljubljana Green area
Water bodies
–
–
–
Modena
Green area
Cool walls
Green roofs Pervious
ground
Cool roofs
Padua
Green area + Trees Cool pavements Cool roofs
S1 + Cool
pavements
–
Prague
New urban
develoment
Green roofs
–
–
–
Stuttgart
Green area
Trees
Water bodies –
–
Vienna
Trees
Green roofs
Combined
–
–
Warsaw
Green
area + Trees + Green
roofs
S1 + Pervious
pavements
–
–
–
A. Mahdavi et al.
for these areas (base case) were modelled using the aforementioned simulation
environment. Fourth, candidate mitigation measures were defined for each of these
areas (see Table 3.4 for an overview). Fifth, the envisioned mitigation measures
were virtually implemented in the simulation environment and corresponding output was generated. Sixth, the base case conditions were compared with the predicted
post-mitigation circumstances to provide a quantitative basis for the evaluation of
the effectiveness of the envisioned mitigation measures.
To illustrate the kinds of information and analyses that can be obtained from the
modelling process, relevant results are provided below for three cities, namely
Vienna, Padua, and Warsaw. Toward this end, Figs. 3.8, 3.9, and 3.10 show the mean
hourly temperature in the course of a reference summer day in Vienna, Padua, and
Warsaw for the base case and three mitigation scenarios. Figures 3.11, 3.12, and
3.13 show the corresponding temperature differences between the base case and the
applicable mitigation scenarios in the course of a reference summer day. These
results point to the potential of various mitigation measures to reduce air temperature levels in hot summer days in the selected cities. As it could be expected,
different mitigation measures display different levels of impact. For example, in
case of the targeted area in Vienna, green roofs do not appear to noticeably influence
the air temperature in the urban canyon. Trees, on the other hand, do impact the air
temperature. The combination of these two measures proved in this case to be most
effective. With regard to the temporal pattern of the effects, it can be noted that the
difference in air temperature is more pronounced during evening and night hours.
To further investigate the temporal nature of UHI intensity values (and their sensitivity to various mitigation measures), we introduced the concepts of Cumulative
Temperature Increase (CTI) and Cumulative Temperature Decrease (CTD). CTI
and CTD are computed as the cumulative sum of all positive and negative values
respectively in the course of a reference day:
Table 3.4 Summary of envisioned mitigation measures
Scenario 1
Scenario 2
Scenario 3
Scenario 4
Scenario 5
Budapest
Green area + Water
bodies
Trees
–
–
–
Ljubljana Green area
Water bodies
–
–
–
Modena
Green area
Cool walls
Green roofs Pervious
ground
Cool roofs
Padua
Green area + Trees Cool pavements Cool roofs
S1 + Cool
pavements
–
Prague
New urban
develoment
Green roofs
–
–
–
Stuttgart
Green area
Trees
Water bodies –
–
Vienna
Trees
Green roofs
Combined
–
–
Warsaw
Green
area + Trees + Green
roofs
S1 + Pervious
pavements
–
–
–
A. Mahdavi et al.