

77
3.4 Long-Term Analyses of the Observations
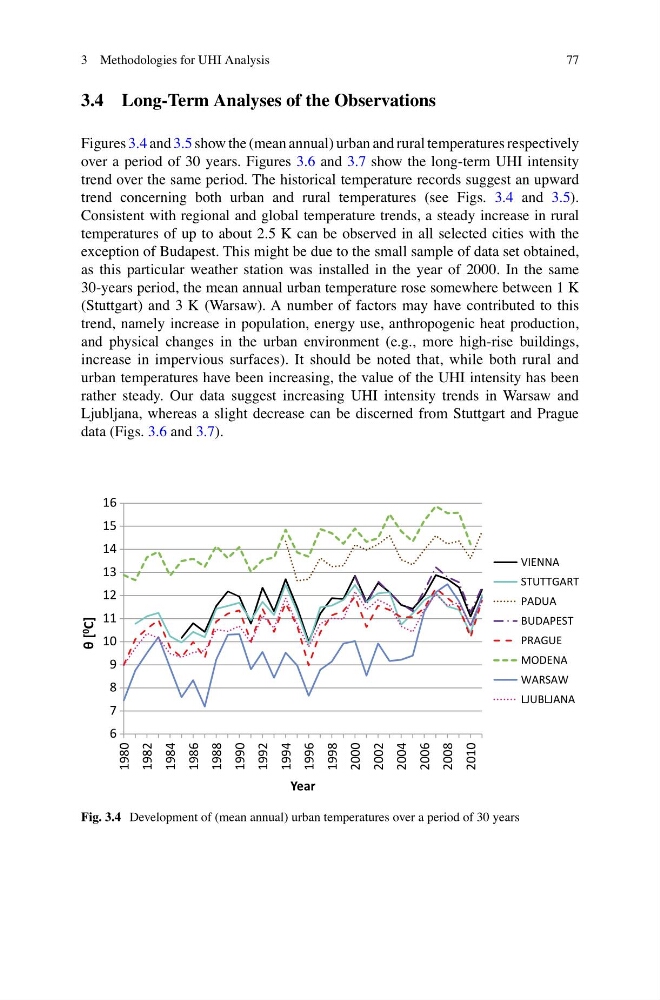
Figures 3.4 and 3.5 show the (mean annual) urban and rural temperatures respectively
over a period of 30 years. Figures 3.6 and 3.7 show the long-term UHI intensity
trend over the same period. The historical temperature records suggest an upward
trend concerning both urban and rural temperatures (see Figs. 3.4 and 3.5).
Consistent with regional and global temperature trends, a steady increase in rural
temperatures of up to about 2.5 K can be observed in all selected cities with the
exception of Budapest. This might be due to the small sample of data set obtained,
as this particular weather station was installed in the year of 2000. In the same
30-years period, the mean annual urban temperature rose somewhere between 1 K
(Stuttgart) and 3 K (Warsaw). A number of factors may have contributed to this
trend, namely increase in population, energy use, anthropogenic heat production,
and physical changes in the urban environment (e.g., more high-rise buildings,
increase in impervious surfaces). It should be noted that, while both rural and
urban temperatures have been increasing, the value of the UHI intensity has been
rather steady. Our data suggest increasing UHI intensity trends in Warsaw and
Ljubljana, whereas a slight decrease can be discerned from Stuttgart and Prague
data (Figs. 3.6 and 3.7).
6
7
8
9
10
11
12
13
14
15
16
1980
1982
1984
1986
1988
1990
1992
1994
1996
1998
2000
2002
2004
2006
2008
2010
θ [ 0
C]
Year
VIENNA
STUTTGART
PADUA
BUDAPEST
PRAGUE
MODENA
WARSAW
LJUBLJANA
Fig. 3.4 Development of (mean annual) urban temperatures over a period of 30 years
3 Methodologies for UHI Analysis
3.4 Long-Term Analyses of the Observations
Figures 3.4 and 3.5 show the (mean annual) urban and rural temperatures respectively
over a period of 30 years. Figures 3.6 and 3.7 show the long-term UHI intensity
trend over the same period. The historical temperature records suggest an upward
trend concerning both urban and rural temperatures (see Figs. 3.4 and 3.5).
Consistent with regional and global temperature trends, a steady increase in rural
temperatures of up to about 2.5 K can be observed in all selected cities with the
exception of Budapest. This might be due to the small sample of data set obtained,
as this particular weather station was installed in the year of 2000. In the same
30-years period, the mean annual urban temperature rose somewhere between 1 K
(Stuttgart) and 3 K (Warsaw). A number of factors may have contributed to this
trend, namely increase in population, energy use, anthropogenic heat production,
and physical changes in the urban environment (e.g., more high-rise buildings,
increase in impervious surfaces). It should be noted that, while both rural and
urban temperatures have been increasing, the value of the UHI intensity has been
rather steady. Our data suggest increasing UHI intensity trends in Warsaw and
Ljubljana, whereas a slight decrease can be discerned from Stuttgart and Prague
data (Figs. 3.6 and 3.7).
6
7
8
9
10
11
12
13
14
15
16
1980
1982
1984
1986
1988
1990
1992
1994
1996
1998
2000
2002
2004
2006
2008
2010
θ [ 0
C]
Year
VIENNA
STUTTGART
PADUA
BUDAPEST
PRAGUE
MODENA
WARSAW
LJUBLJANA
Fig. 3.4 Development of (mean annual) urban temperatures over a period of 30 years
3 Methodologies for UHI Analysis