

75
The reference week data clearly demonstrate the existence and significant magnitude of the UHI effect in participating cities, especially during the night hours
(Fig. 3.3). However, the time-dependent UHI patterns vary considerably across the
participating cities. In Warsaw, for example, UHI intensity level ranges from around
1 K during daytime to almost 7 K during the night, while in Stuttgart levels are
rather steady, ranging from 1 K to 2 K. The UHI pattern differences are also visible
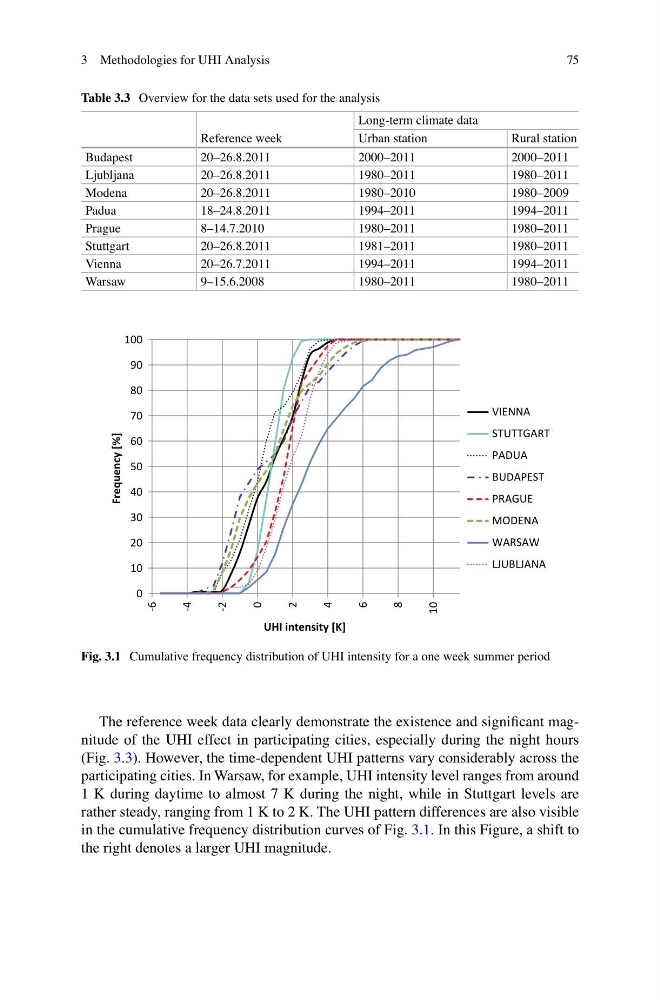
in the cumulative frequency distribution curves of Fig. 3.1. In this Figure, a shift to
the right denotes a larger UHI magnitude.
Table 3.3 Overview for the data sets used for the analysis
Reference week
Long-term climate data
Urban station
Rural station
Budapest
20–26.8.2011
2000–2011
2000–2011
Ljubljana
20–26.8.2011
1980–2011
1980–2011
Modena
20–26.8.2011
1980–2010
1980–2009
Padua
18–24.8.2011
1994–2011
1994–2011
Prague
8–14.7.2010
1980–2011
1980–2011
Stuttgart
20–26.8.2011
1981–2011
1980–2011
Vienna
20–26.7.2011
1994–2011
1994–2011
Warsaw
9–15.6.2008
1980–2011
1980–2011
0
10
20
30
40
50
60
70
80
90
100
-6
-4
-2
0
2
4
6
8
10
Frequency [%]
UHI intensity [K]
VIENNA
STUTTGART
PADUA
BUDAPEST
PRAGUE
MODENA
WARSAW
LJUBLJANA
Fig. 3.1 Cumulative frequency distribution of UHI intensity for a one week summer period
3 Methodologies for UHI Analysis
The reference week data clearly demonstrate the existence and significant magnitude of the UHI effect in participating cities, especially during the night hours
(Fig. 3.3). However, the time-dependent UHI patterns vary considerably across the
participating cities. In Warsaw, for example, UHI intensity level ranges from around
1 K during daytime to almost 7 K during the night, while in Stuttgart levels are
rather steady, ranging from 1 K to 2 K. The UHI pattern differences are also visible
in the cumulative frequency distribution curves of Fig. 3.1. In this Figure, a shift to
the right denotes a larger UHI magnitude.
Table 3.3 Overview for the data sets used for the analysis
Reference week
Long-term climate data
Urban station
Rural station
Budapest
20–26.8.2011
2000–2011
2000–2011
Ljubljana
20–26.8.2011
1980–2011
1980–2011
Modena
20–26.8.2011
1980–2010
1980–2009
Padua
18–24.8.2011
1994–2011
1994–2011
Prague
8–14.7.2010
1980–2011
1980–2011
Stuttgart
20–26.8.2011
1981–2011
1980–2011
Vienna
20–26.7.2011
1994–2011
1994–2011
Warsaw
9–15.6.2008
1980–2011
1980–2011
0
10
20
30
40
50
60
70
80
90
100
-6
-4
-2
0
2
4
6
8
10
Frequency [%]
UHI intensity [K]
VIENNA
STUTTGART
PADUA
BUDAPEST
PRAGUE
MODENA
WARSAW
LJUBLJANA
Fig. 3.1 Cumulative frequency distribution of UHI intensity for a one week summer period
3 Methodologies for UHI Analysis