

plagioclase, respectively. Examining Al (Fig. 4.27d) and Si (Fig. 4.27e) element
maps, thin stripes of the plagioclase phenocrysts are evident. The Al concentration is
higher than the Si concentration in these thin stripes as shown by the EDX spectrum
(Fig. 4.27b). Two possibilities exist for the formation of the allophanic thin stripes.
One is the formation of altermorphs of plagioclase and the other is precipitation of
allophanic materials in the cleavage opening.
The 3Bw5 horizon of Fig. 4.19a is a highly weathered example formed from Na-I
tephra. The weathered particle is almost wholly reddish yellow to yellow
(Fig. 4.28a). The many small vacant bubbles visible in the SEM image of
Fig. 4.28b are probably due to inadequate penetration of resin into the small
vesicular pores. The Al (Fig. 4.28c) and Si (Fig. 4.28d) element maps show that
the majority is Al-rich and Si-poor, except for several small spots in the Si element
map. To examine the fine structure of the inside of the particle, a small red square
(Fig. 4.28b) was selected and magnified in Fig. 4.29.
The magnified SEM image (Fig. 4.29a) shows that an altermorph of the vesicle
walls remains and that materials with diffuse boundaries are filling part of the pores.
The EDX spectra of the red squares (b) and (c) in Fig. 4.29a show that these are both
Al-rich materials, possibly allophanic in nature. The Al (Fig. 4.29d) and Si
(Fig. 4.29e) element maps show that no glassy parts remain. Although the peaks
are small, the iron content is higher than that in Fig. 4.26c, d. The reddish yellow
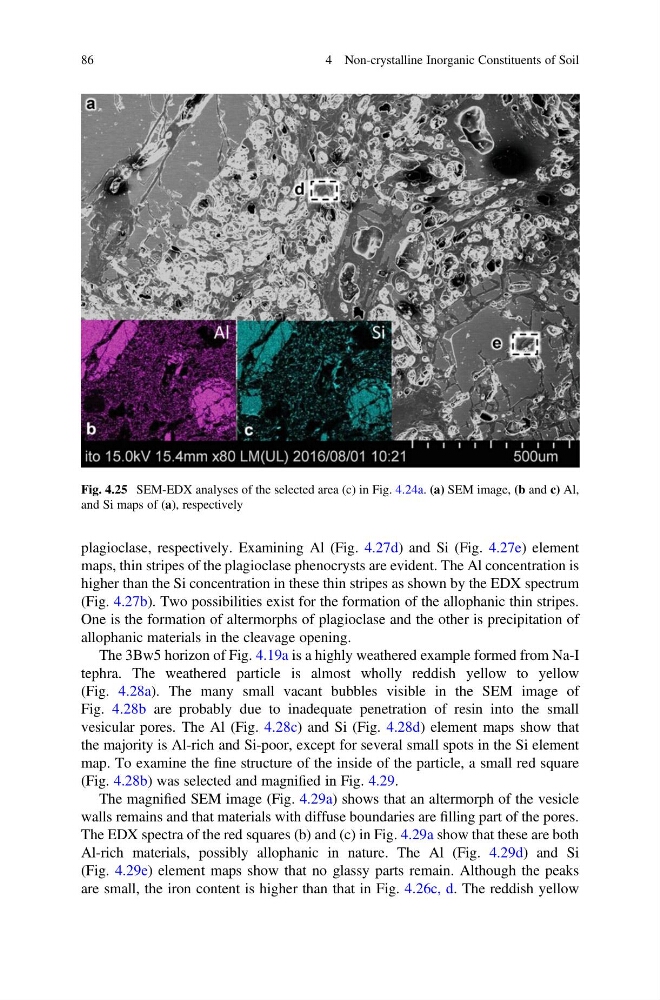
Fig. 4.25 SEM-EDX analyses of the selected area (c) in Fig. 4.24a. (a) SEM image, (b and c) Al,
and Si maps of (a), respectively
86
4 Non-crystalline Inorganic Constituents of Soil
maps, thin stripes of the plagioclase phenocrysts are evident. The Al concentration is
higher than the Si concentration in these thin stripes as shown by the EDX spectrum
(Fig. 4.27b). Two possibilities exist for the formation of the allophanic thin stripes.
One is the formation of altermorphs of plagioclase and the other is precipitation of
allophanic materials in the cleavage opening.
The 3Bw5 horizon of Fig. 4.19a is a highly weathered example formed from Na-I
tephra. The weathered particle is almost wholly reddish yellow to yellow
(Fig. 4.28a). The many small vacant bubbles visible in the SEM image of
Fig. 4.28b are probably due to inadequate penetration of resin into the small
vesicular pores. The Al (Fig. 4.28c) and Si (Fig. 4.28d) element maps show that
the majority is Al-rich and Si-poor, except for several small spots in the Si element
map. To examine the fine structure of the inside of the particle, a small red square
(Fig. 4.28b) was selected and magnified in Fig. 4.29.
The magnified SEM image (Fig. 4.29a) shows that an altermorph of the vesicle
walls remains and that materials with diffuse boundaries are filling part of the pores.
The EDX spectra of the red squares (b) and (c) in Fig. 4.29a show that these are both
Al-rich materials, possibly allophanic in nature. The Al (Fig. 4.29d) and Si
(Fig. 4.29e) element maps show that no glassy parts remain. Although the peaks
are small, the iron content is higher than that in Fig. 4.26c, d. The reddish yellow
Fig. 4.25 SEM-EDX analyses of the selected area (c) in Fig. 4.24a. (a) SEM image, (b and c) Al,
and Si maps of (a), respectively
86
4 Non-crystalline Inorganic Constituents of Soil