

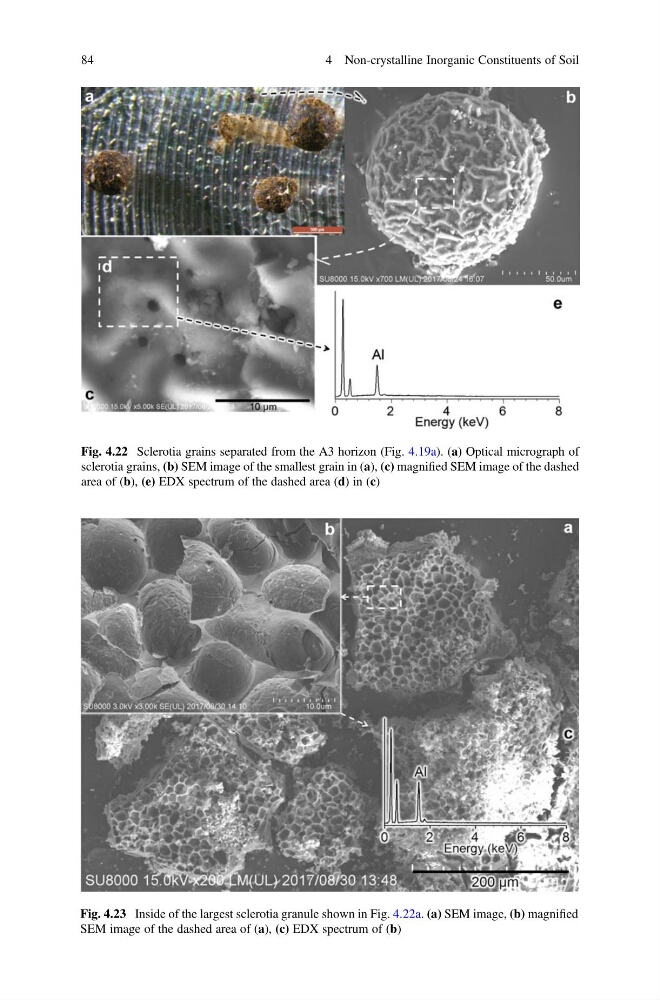
Fig. 4.23 Inside of the largest sclerotia granule shown in Fig. 4.22a. (a) SEM image, (b) magnified
SEM image of the dashed area of (a), (c) EDX spectrum of (b)
Fig. 4.22 Sclerotia grains separated from the A3 horizon (Fig. 4.19a). (a) Optical micrograph of
sclerotia grains, (b) SEM image of the smallest grain in (a), (c) magnified SEM image of the dashed
area of (b), (e) EDX spectrum of the dashed area (d) in (c)
84
4 Non-crystalline Inorganic Constituents of Soil
SEM image of the dashed area of (a), (c) EDX spectrum of (b)
Fig. 4.22 Sclerotia grains separated from the A3 horizon (Fig. 4.19a). (a) Optical micrograph of
sclerotia grains, (b) SEM image of the smallest grain in (a), (c) magnified SEM image of the dashed
area of (b), (e) EDX spectrum of the dashed area (d) in (c)
84
4 Non-crystalline Inorganic Constituents of Soil