

6.3.4 Transportation of Radiocesium in Rivers Estimated
from Side Bar Deposits
The radiocesium deposited on a soil surface is fixed by soil particles (Shiozawa
2013; Nakao et al. 2014). However, when the soil particles move because of erosion,
the radiocesium moves with the particles. High radiocesium concentration was
detected in the water treatment residue (WTR) (Ippolito et al. 2011) from the
Aganogawa water purification plant which locate near Ounbashi sampling site
(OUT) in Fig. 6.17, 170 km away from FNPP. In the case of rivers, soil particles
move with the water in suspended form, particularly during heavy rains (Evrard et al.
2014), and are eventually deposited as bars. Bars are often found in slow-flowing,
shallow parts of a river.
The Fukushima nuclear accident in 2011 was followed by snowmelt, heavy rain,
and a typhoon, which caused rising levels of muddy water in rivers and the formation
of bars. Information about the transportation and deposition of soil particles with
radiocesium may be obtained from these side bars.
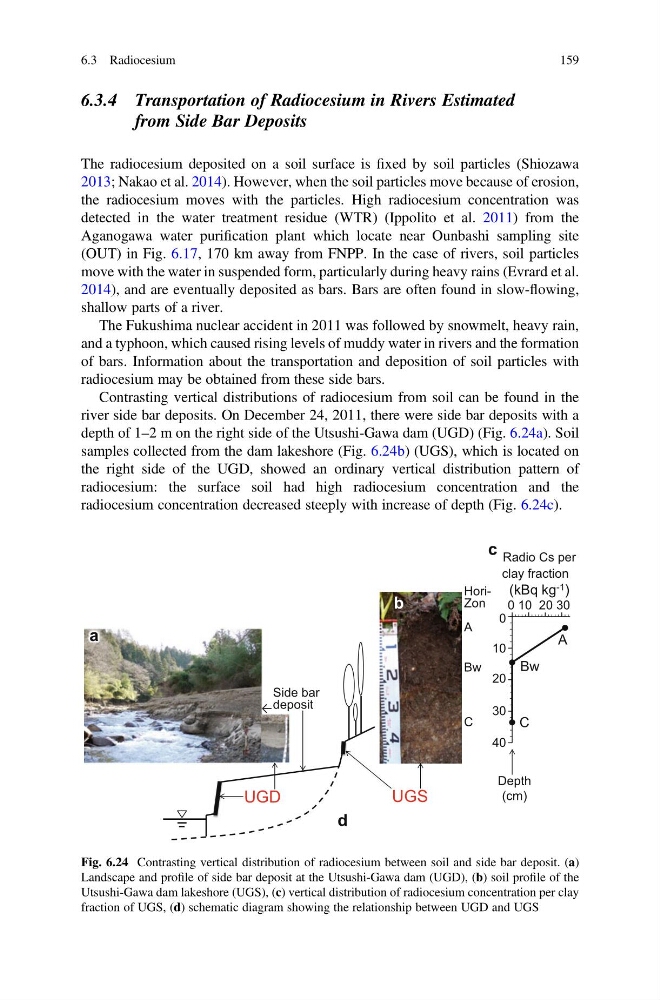
Contrasting vertical distributions of radiocesium from soil can be found in the
river side bar deposits. On December 24, 2011, there were side bar deposits with a
depth of 1–2 m on the right side of the Utsushi-Gawa dam (UGD) (Fig. 6.24a). Soil
samples collected from the dam lakeshore (Fig. 6.24b) (UGS), which is located on
the right side of the UGD, showed an ordinary vertical distribution pattern of
radiocesium: the surface soil had high radiocesium concentration and the
radiocesium concentration decreased steeply with increase of depth (Fig. 6.24c).
Side bar
deposit
←
UGS
UGD
a
c
b
d
0 10 20 30
0
10
20
30
40
Depth
(cm)
A
Bw
C
HoriZon
A
Bw
C
Radio Cs per
clay fraction
(kBq kg -1 )
Fig. 6.24 Contrasting vertical distribution of radiocesium between soil and side bar deposit. (a)
Landscape and profile of side bar deposit at the Utsushi-Gawa dam (UGD), (b) soil profile of the
Utsushi-Gawa dam lakeshore (UGS), (c) vertical distribution of radiocesium concentration per clay
fraction of UGS, (d) schematic diagram showing the relationship between UGD and UGS
6.3 Radiocesium
159
from Side Bar Deposits
The radiocesium deposited on a soil surface is fixed by soil particles (Shiozawa
2013; Nakao et al. 2014). However, when the soil particles move because of erosion,
the radiocesium moves with the particles. High radiocesium concentration was
detected in the water treatment residue (WTR) (Ippolito et al. 2011) from the
Aganogawa water purification plant which locate near Ounbashi sampling site
(OUT) in Fig. 6.17, 170 km away from FNPP. In the case of rivers, soil particles
move with the water in suspended form, particularly during heavy rains (Evrard et al.
2014), and are eventually deposited as bars. Bars are often found in slow-flowing,
shallow parts of a river.
The Fukushima nuclear accident in 2011 was followed by snowmelt, heavy rain,
and a typhoon, which caused rising levels of muddy water in rivers and the formation
of bars. Information about the transportation and deposition of soil particles with
radiocesium may be obtained from these side bars.
Contrasting vertical distributions of radiocesium from soil can be found in the
river side bar deposits. On December 24, 2011, there were side bar deposits with a
depth of 1–2 m on the right side of the Utsushi-Gawa dam (UGD) (Fig. 6.24a). Soil
samples collected from the dam lakeshore (Fig. 6.24b) (UGS), which is located on
the right side of the UGD, showed an ordinary vertical distribution pattern of
radiocesium: the surface soil had high radiocesium concentration and the
radiocesium concentration decreased steeply with increase of depth (Fig. 6.24c).
Side bar
deposit
←
UGS
UGD
a
c
b
d
0 10 20 30
0
10
20
30
40
Depth
(cm)
A
Bw
C
HoriZon
A
Bw
C
Radio Cs per
clay fraction
(kBq kg -1 )
Fig. 6.24 Contrasting vertical distribution of radiocesium between soil and side bar deposit. (a)
Landscape and profile of side bar deposit at the Utsushi-Gawa dam (UGD), (b) soil profile of the
Utsushi-Gawa dam lakeshore (UGS), (c) vertical distribution of radiocesium concentration per clay
fraction of UGS, (d) schematic diagram showing the relationship between UGD and UGS
6.3 Radiocesium
159